Changelog

New features, improvements, and fixes in Attribuly.

Have an idea? Share feedback · Roadmap

Recapture now supports ActiveCampaign

Recapture now integrates with ActiveCampaign, helping merchants identify more missed cart abandoners and reach them through abandonment emails.

  1. Recover more abandoned shoppers: Identify shoppers and their behavior that ActiveCampaign may have missed.
  2. Trigger abandonment emails: Sync identified shoppers and their behavioral data to ActiveCampaign to trigger recovery flows and create more opportunities to engage and convert.

Connect ActiveCampaign

Read the setup guide

View update

Post-purchase survey: Learn where customers first discovered your brand

A customer may complete a purchase through Google after first discovering your brand on TikTok. Click attribution alone can understate the value of some channels.

The Post-Purchase Survey asks customers where they first heard about your brand after checkout, adding another perspective to your attribution data.

Highlights

  1. Customize answer options: Add sources such as TikTok, Google, or a friend.
  2. Connect answers to channels: Map survey responses to marketing channels for analysis.
  3. Randomize options: Shuffle answers to reduce selection bias.

Get started: Go to Attribuly → Marketing Analytics → Post-Purchase Survey → Setup.

Set up the survey

Read the setup guide

View update

Capture can now sync identified emails to SHOPLINE

Capture can now automatically sync identified visitor email addresses to your SHOPLINE admin, making it easier to manage and reach potential customers.

  • Improve email quality: Stricter identification conditions help reduce bounce and complaint risks.
  • Reach shoppers sooner: Automatic sync removes manual export and import steps, shortening the time between identification and email outreach.

Set up SHOPLINE sync

Read the setup guide

View update

New: Auto-Tag Captured Emails in Shopify with "Attribuly Capture"

We've just made it way easier to segment your Capture leads right inside Shopify. 🥳

What's new

Attribuly now automatically syncs all emails captured by the Capture feature to your Shopify admin on a schedule. Each synced email gets tagged with Attribuly Capture, so you can instantly pull up a list of every visitor who dropped their email via Capture.

No more manual CSV exports → imports. It just runs in the background.

How to use it

1. Connect the destination (one-time setup)
Go to Destinations → Email→ Shopify and make sure your Shopify integration is enabled. Once it's on, the auto-tagging runs on the schedule — no extra setup needed.

2. Filter customers in Shopify
Open your Shopify Admin → Customers page, then filter by the tag:

View update

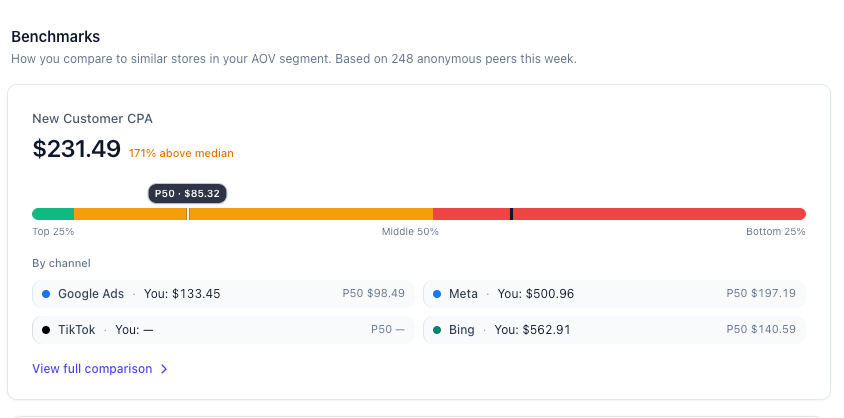
📣 Introducing: New Customer CPA (NC CPA) Benchmarks — Free for All Merchants

🎁 : All Benchmark metrics (NC CPA today, and every metric we add next) are 100% free forever for every merchant on Attribuly — no paid plan required.

What's launching today: New Customer CPA Benchmark

image

How NC CPA is calculated

  • ✅ Only FIRST purchases count. Not repeat orders — because that's what "customer acquisition cost" actually means.
  • ✅ Attributed using Attribuly Full Impact model. 30-day click window + 1-day view window with a balanced 40/40/20 position weighting (first/last/middle). The same calculation our recommendations engine uses.
  • ✅ Advertising spend only. Pure media cost from Google / Meta / TikTok / Bing. Affiliate payouts excluded — keeping it directly comparable across stores.
  • ✅ 28-day rolling window. Anchored on your order date, so the number answers the question: What did I pay to buy new customers in the last 28 days?
  • ✅ Cancelled / fully-refunded orders removed. But partial refunds, offline orders, and test orders are still included (loose filter — no phantom NC CPA drops).

What you'll see on your dashboard

Home → Benchmarks sectionYour NC CPA vs peer P50, with a gradient bar showing Top 25% / Middle 50% / Bottom 25% ranges. One glance tells you if you're competitive.
Benchmarks detail page (click View full comparison)6 metric cards (NC CPA, CPA, CPC, ROAS, CVR, MER) side-by-side, plus Google / Meta / TikTok / Bing per-channel breakdowns.
Future: Recommendations cardsUpcoming evidence rows will surface NC CPA benchmarks when we flag your spend structure (e.g. "Your Brand Search NC CPA is 36% below peer median — this is a well-tuned budget.")

🗺️ Coming Soon: More Benchmark Metrics (all free)

This is just the beginning. Over the next 8 weeks we're shipping these — on the house:

NC CPA ✅ Released"What should I pay for a new customer?"Today
CPA (total conversions)"What's my blended cost per action, compared to similar stores?"Next 2 weeks
CPC"Am I overpaying per click on Google vs peers?"Next 2 weeks
Blended ROAS"Is my $1 of ad spend turning into more or less revenue than the competition?"Month 2
CVR (Conversion Rate)"Should I fix my ads first, or my landing page?"Month 2
MER (Marketing Efficiency Ratio)"What % of my revenue is going out the door as ad spend?"Month 3
Secret metric 7 🤫Ask us in-app! Feedback from merchants shapes this column.Month 3

How to see yours — right now

  1. Go to Home → scroll down to the Benchmarks card (just below Business Performance Summary).
  2. Connect Shopify + at least one Ads integration (Google / Meta / TikTok / Bing) if you haven't already. Takes ~30 seconds.
  3. Your NC CPA card loads instantly. Click View full comparison to open the full Benchmarks page.

🔒 Your data never leaves the pool individually. Every benchmark number is aggregated and anonymized — other merchants never see your store, and you never see theirs. It's a one-way mirror: everyone gets the market-level truth, nobody gets anyone's private numbers.

Questions? Feedback? Tell us what metric you want next.

View update

MambaSMS Integration

New Feature
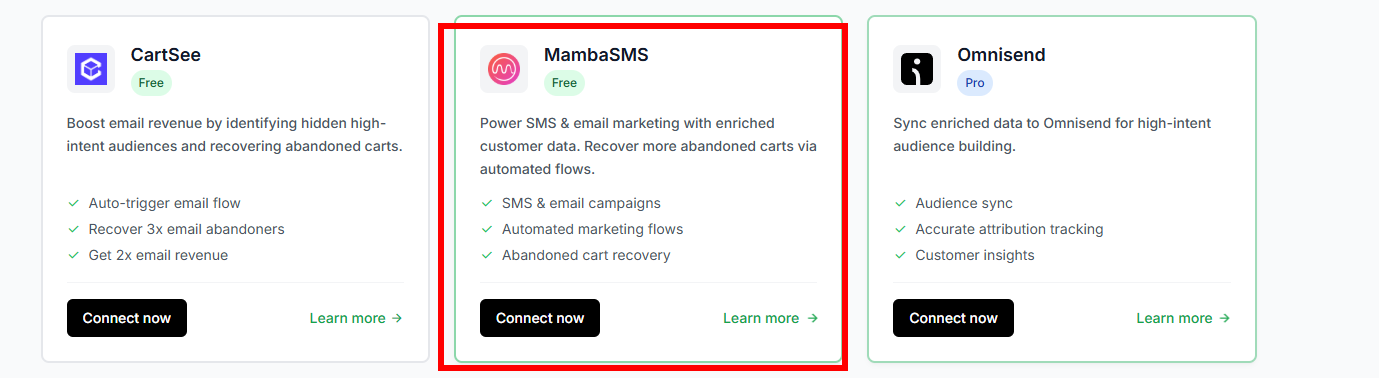
MambaSMS Integration Support

  • Added official integration with MambaSMS,
  • Users can configure MambaSMS callback destinations in the Attribuly platform after successful integration. Integration setup: Go to Connections → Sources and select MambaSMS to set up the integration. For destination configuration, navigate to Connections → Destinations. image

Important Notes

  • A valid MambaSMS registered store account is required before enabling the integration.
  • After completing callback configuration on the Attribuly side, please contact the MambaSMS team to configure the corresponding flow to complete the full business data pipeline.
View update

Channel Shopify Shop Attribution Update

Background

We are improving Shopify Shop attribution so that orders and visits from the Shop app can be identified more consistently in attribution paths.

Previously, Shopify Shop events were mainly added during order backfill. This could miss some cases, such as orders that already had tracking events or orders that matched other visits during backfill.

Changes

Order-Level Rule

During attribution path cleaning, we will check each order's channel_name.

If channel_name = Shop, a shopify_shop event will be added to the order's attribution path.

Visit-Level Rule

When a visit URL contains utm_source=shop_app, the visit will be recognized as shopify_shop.

This rule will not apply if page_referrer is from the same website.

Benefits

  • Improves Shopify Shop attribution accuracy.
  • Makes Shop app orders visible in attribution paths.
  • Prevents internal site navigation from being incorrectly classified as Shopify Shop.
  • Keeps reporting more consistent with Shopify order channel data.

Problem Solved

With this update, Shopify Shop can be identified from both the order channel and visit UTM signals.

View update

Segment Filtering by Customer Total Spend

What Is New

You can now build customer segments based on each customer's total order amount.

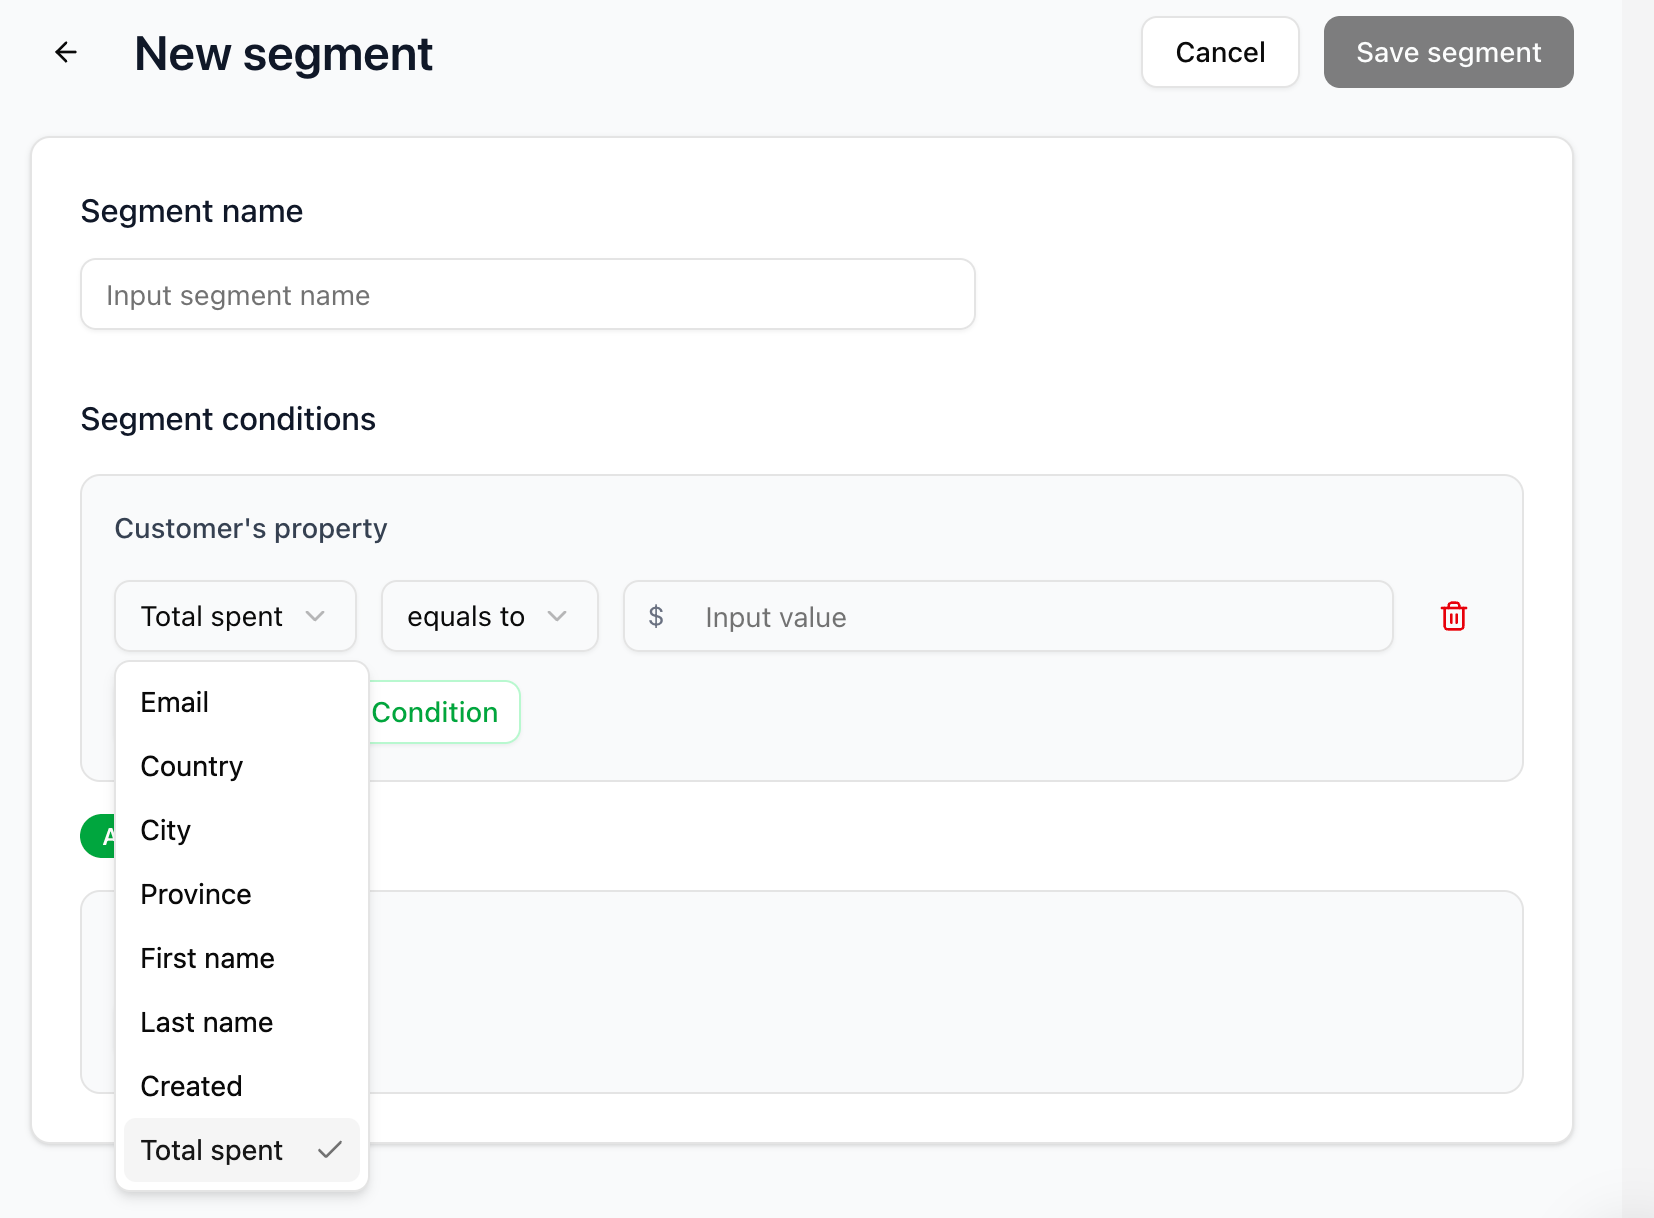
In Segment conditions, the Customer's property section now includes a new property:

  • Total spent

This condition uses the customer's lifetime total order amount from Shop customer data. It helps you create more precise customer groups based on purchase value, such as high-value customers, low-spend customers, or customers who have not reached a target purchase threshold yet.

How To Use It

  1. Go to Store.
  2. Open Segments.
  3. Create a new segment or edit an existing segment.
  4. In Segment conditions, find the Customer's property section.
  5. Add a new condition.
  6. Select Total spent as the property.
  7. Choose a comparison operator:
    • is greater than
    • is less than
    • equals to
    • does not equal
  8. Enter the spend amount you want to use for filtering.
  9. Save the segment. image

Example Use Cases

High-Value Customers

Create a segment for customers whose total order amount is greater than 500.

Example:

Customer's property: Total spent Condition: is greater than Value: 500

This segment can be used to identify loyal or high-value customers for VIP campaigns, retention programs, or exclusive offers.

Customers Below A Purchase Threshold

Create a segment for customers whose total order amount is less than 100.

Example:

Customer's property: Total spent Condition: is less than Value: 100

This segment can help you find customers who have purchased but have not yet reached a meaningful spending level.

Exact Spend Matching

Create a segment for customers whose total order amount equals a specific value.

Example:

Customer's property: Total spent Condition: equals to Value: 0

This can help you identify customers with no recorded spending in Shop customer data.

Currency Display

The amount input displays the store's currency symbol automatically.

For example:

$ 500 € 500 ¥ 500

The currency symbol is shown to make the input easier to understand. The segment condition itself is saved as a numeric amount, so the filtering logic remains consistent with the store's Shop customer data.

What Problem This Solves

Before this update, customer segments could be built from customer attributes and behavior events, but there was no simple way to filter customers by their total order amount.

With this update, merchants can:

  • Find customers who have spent more than a specific amount.
  • Build high-value customer segments for retention and loyalty campaigns.
  • Separate low-spend customers from repeat or VIP customers.
  • Create more targeted audiences for email, ads, and customer lifecycle campaigns.
  • Use Shop customer lifetime spend directly in segmentation rules.

Data Source

This condition is calculated from Shop customer data.

The filtering logic uses:

shop_customers.total_spent

This means the segment is based on the total amount recorded for each Shop customer.

Notes

  • The value should be entered as a number only.
  • The store currency symbol is displayed automatically in the input field.
  • Supported operators are currently greater than, less than, equals to, and does not equal.
  • The condition works together with other segment conditions, so it can be combined with customer properties and customer behavior rules.
View update

New Metric: Click Conversion Rate

We’ve added a new metric, Click Conversion Rate, to help you better understand how efficiently ad clicks turn into conversions.

Click Conversion Rate is calculated as:

Conversions / Clicks × 100%

Previously, clicks and conversions were available as separate metrics, but it was harder to quickly evaluate how effectively clicks were turning into conversions. This new metric makes it easier to compare performance across campaigns, ad sets, ads, and other attribution breakdowns.

You can view Click Conversion Rate in both All Attribution and Ads Attribution reports. Open either report and check the Click conversion rate column in the data table. If the column is not visible, update your table column settings to include Click conversion rate.

View update

Compare Ad Attribution Performance Across Date Ranges

Previously, Ads Attribution only showed one date range at a time, so users had to manually switch dates or export reports to compare performance. With date comparison, users can now evaluate performance changes directly in the report and identify what changed between two periods.

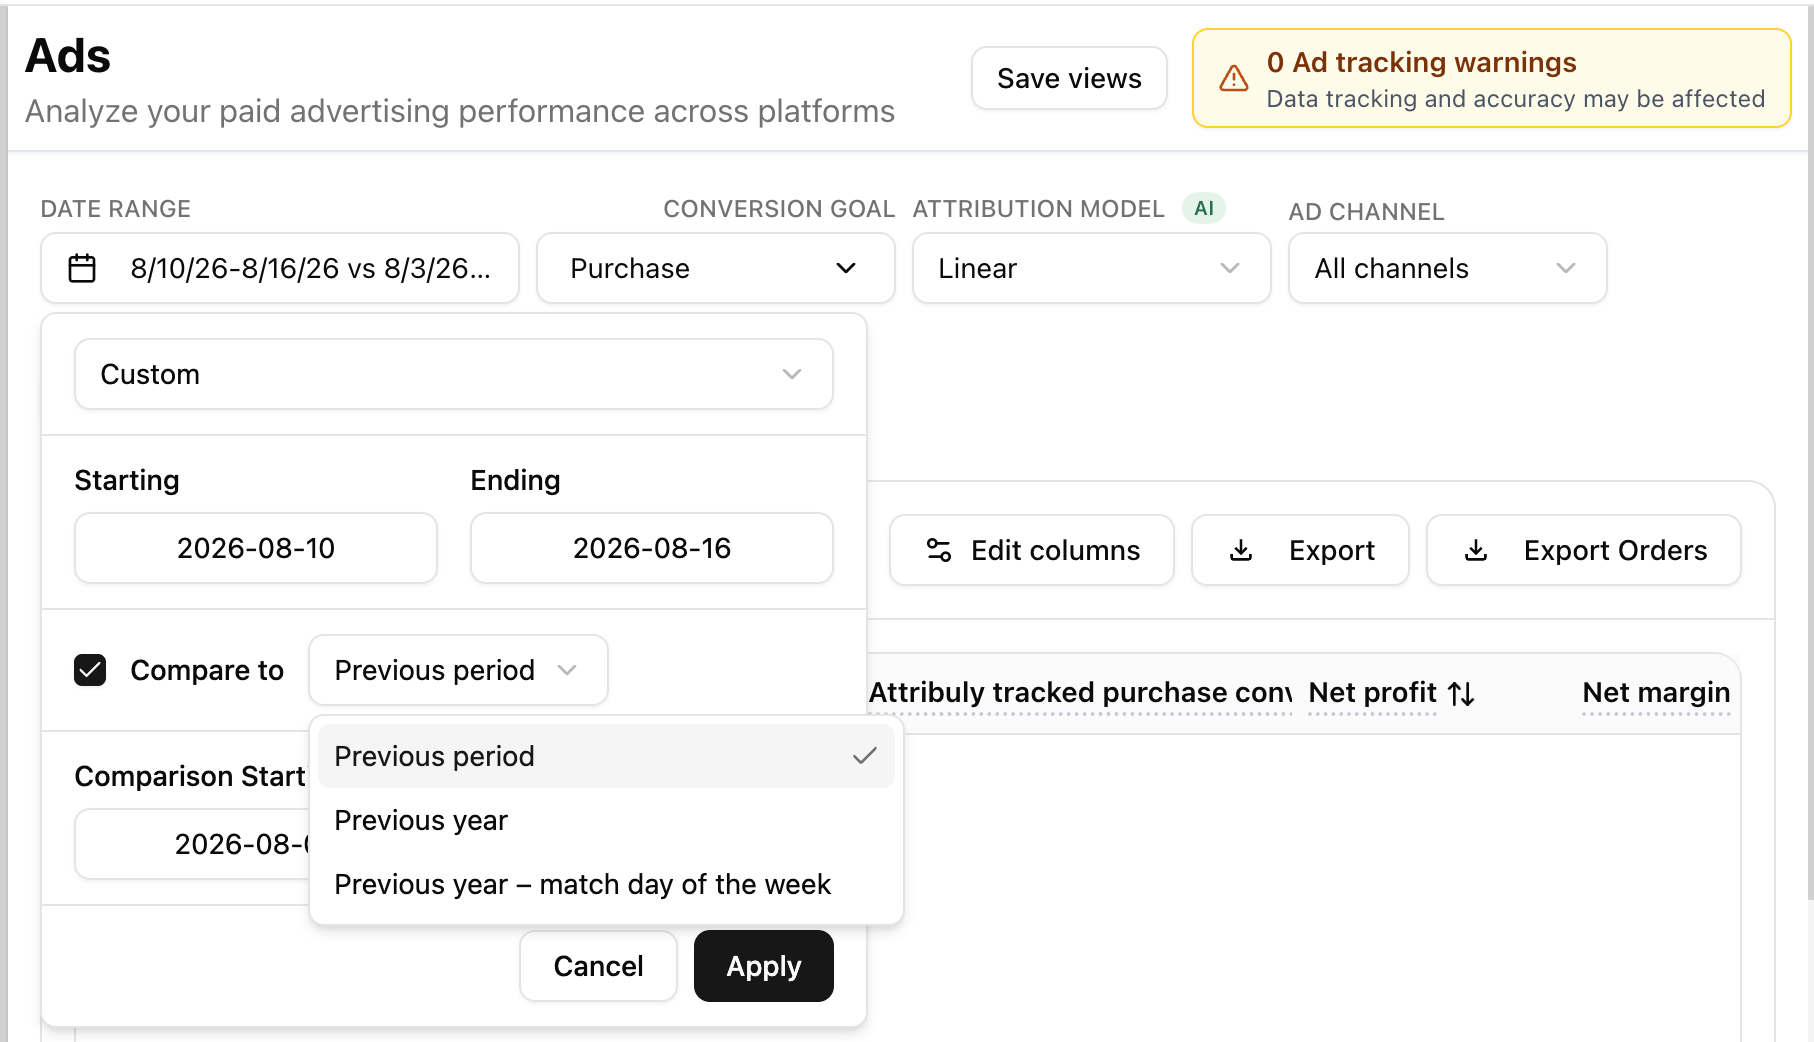
What’s New You can now use Compare to in the Ads Attribution date picker, just like in All Attribution. This lets you compare your current reporting period against a previous period, previous year, or a custom date range directly inside the Ads Attribution report.

How To Use

  • Go to Attribution > Ads.
  • Open the date range picker.
  • Select your main date range.
  • Turn on Compare to.
  • Choose a comparison option such as Previous period, Previous year, or a custom comparison range.
  • Click Apply to refresh the report.
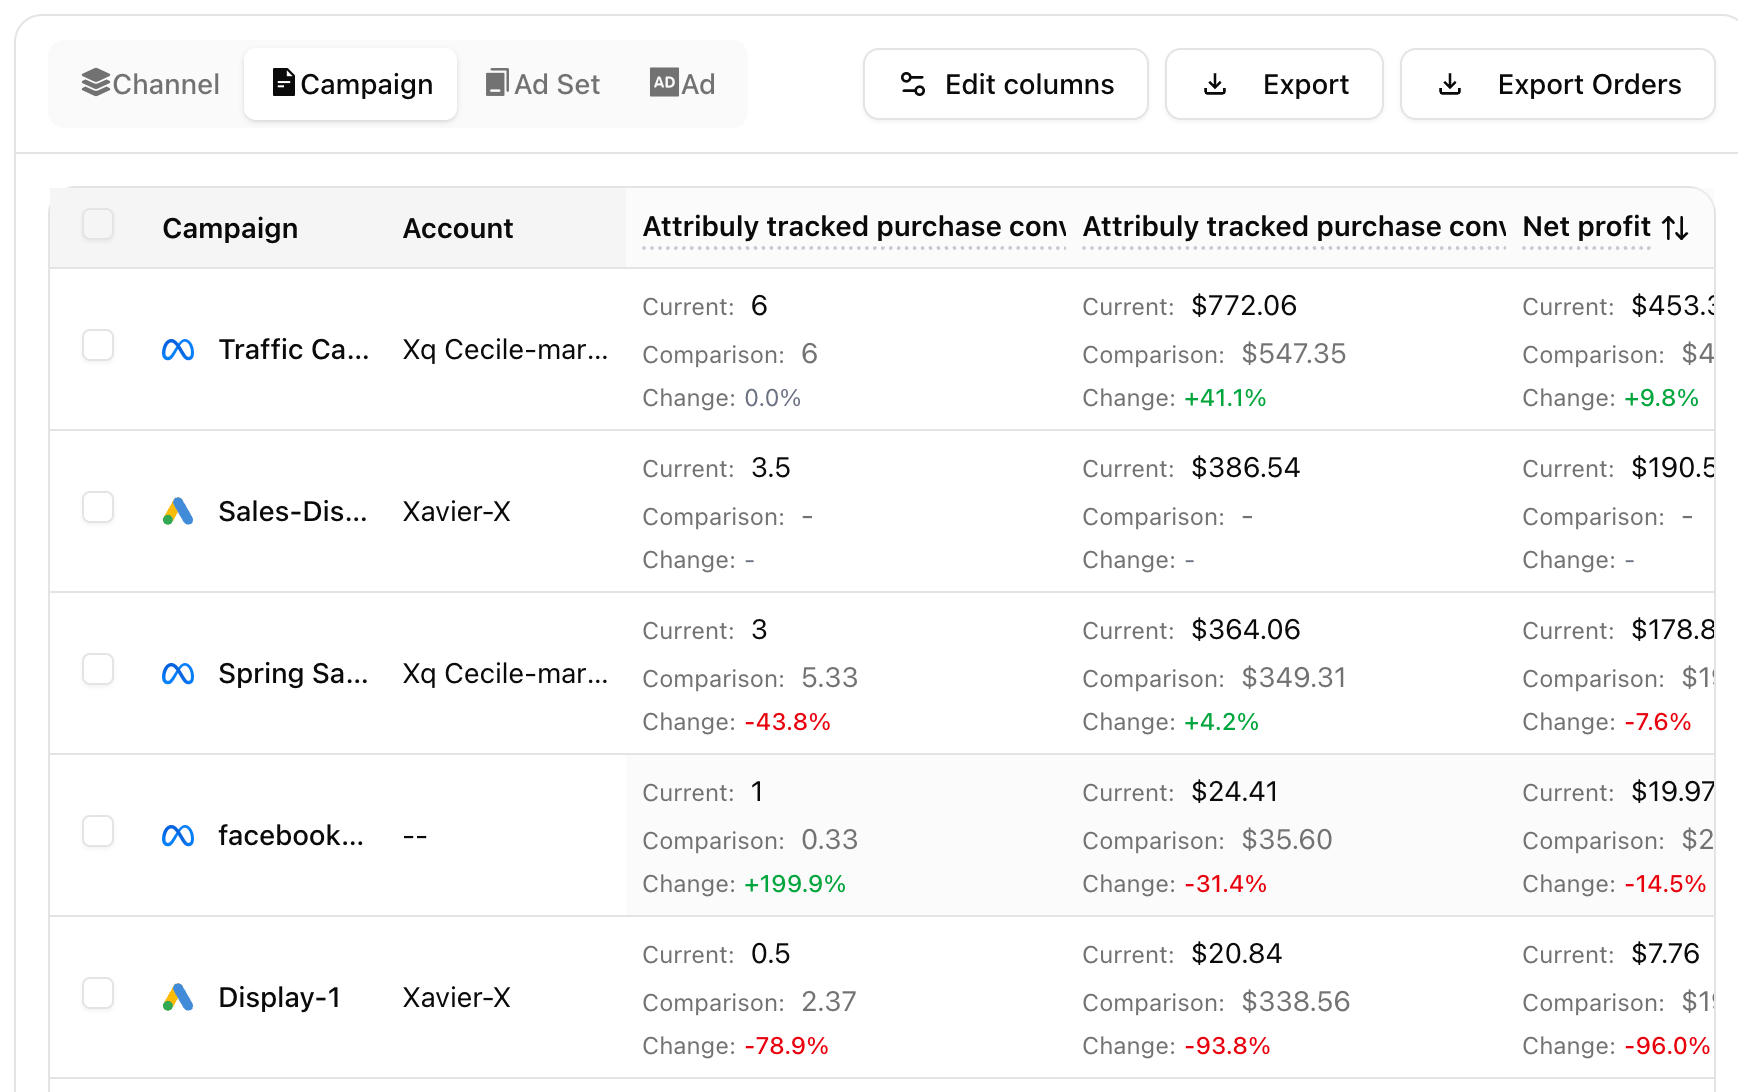
  • Review each metric in the table with Current, Comparison, and Change values. image

What You’ll See

  • Each Ads Attribution metric now shows the current period value.
  • The matching comparison period value appears directly below it.
  • A percentage change is shown so you can quickly identify increases or decreases.
  • Totals also include current, comparison, and change values. image

Why It Helps

  • Quickly understand whether ad performance improved or declined.
  • Compare campaigns, ad sets, ads, and channels across different periods.
  • Spot spend, ROAS, CPA, conversion, and revenue changes without exporting data.
  • Make faster optimization decisions based on period-over-period performance.
View update
Showing 10 of 149