
Furniture & Home Decor Marketing Attribution: Why Meta and Shopify Disagree
Learn why Meta, Google, Shopify, GA4, and your ESP claim different furniture and home decor sales—and build a framework without double counting.
Related articles
TL;DR
- Never add Meta, Google, Pinterest, and ESP-reported conversions to calculate total orders.
- Use the commerce backend for booked orders, revenue, refunds, and cancellations.
- Use platform reporting to optimize activity inside that platform, with its attribution settings documented.
- Use cross-channel attribution to analyze connected journeys under one set of rules.
- Treat Direct and branded search as possible return paths, not automatic proof that earlier marketing had no influence.
- Validate large budget changes with blended metrics, customer feedback, and controlled experiments.
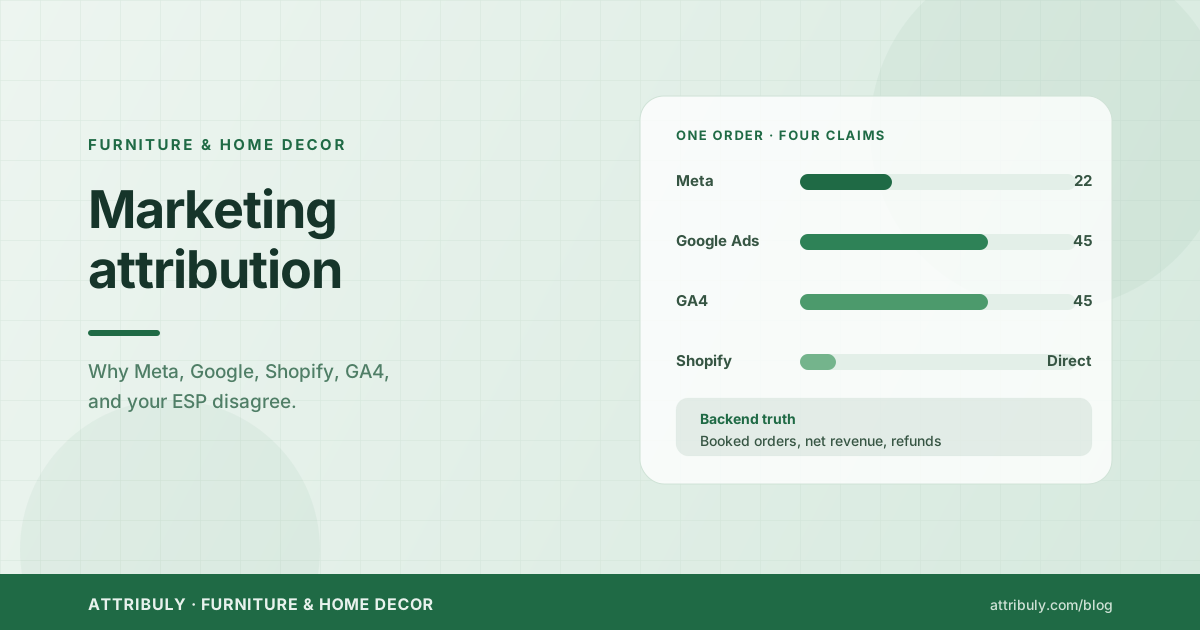
This is a recurring public question among ecommerce and paid-media teams. It becomes especially important for furniture and home decor because shoppers do not usually click one ad and buy a sofa in the same session. They discover a product, compare alternatives, read reviews, measure the room, discuss the purchase, return through search or email, and may convert days or weeks later on another device.
The solution is not to force every system to show the same number. It is to assign each system a job, reconcile the underlying data, and make budget decisions with a consistent set of lenses.
Why the dashboards disagree
Each system observes and assigns credit differently.
Meta and Google optimize their own ecosystems
An ad platform can claim a purchase when an eligible ad interaction falls within its attribution window. Depending on settings and available data, that can include modeled or view-through conversions. Google may claim a click-assisted order that Meta also claims after an earlier impression.
Both claims can refer to the same order. They are not two orders.
Shopify records commerce and a limited path
Shopify is the most important record of whether an order exists, how much the customer paid, and whether it was refunded or cancelled. Its channel or conversion path depends on the sessions and referrer data it can attach to the order.
If the shopper returns directly, switches devices, clears identifiers, completes after speaking to sales, or uses a link without UTMs, the visible path may be incomplete.
GA4 applies its own identity and attribution rules
GA4 is useful for on-site acquisition, landing-page, and path analysis. Its totals can differ because of consent, blockers, event configuration, identity, attribution model, reporting window, and timezone.
Before debating channel credit, verify that GA4 purchase events reconcile reasonably with backend orders after accounting for cancellations, test transactions, timezone, and known consent loss.
Your ESP measures message influence
Klaviyo, Omnisend, and other lifecycle platforms may credit an order after an open or click within their configured window. That is useful for flow and campaign optimization, but the same order may also be claimed by an ad platform.
A furniture journey that creates four answers
Consider this path:
- The shopper watches a Meta video for a modular sofa.
- Three days later, they search the brand on Google.
- They compare two configurations and request a swatch.
- An email reminds them that the swatch arrived and links to the product.
- They discuss the purchase with a partner.
- They return directly on a laptop and order.
Meta may claim discovery or a view-through conversion. Google may claim the branded click. The ESP may claim the email click. Shopify may show Direct as the last session. Each describes one part of the journey.
The business needs three separate answers:
- What happened financially? The order, net revenue, margin, cancellation, and return.
- What should each platform optimize? The signals that help Meta, Google, or the ESP improve inside its own system.
- How should budget move across channels? A cross-channel view using common rules, blended outcomes, and experiments.
Do not ask one dashboard to answer all three.
Step 1: Establish the commerce source of truth
Build a daily order table from the commerce backend with:
- order ID;
- order timestamp and timezone;
- gross and net revenue;
- discount;
- shipping and tax;
- product and category;
- new or returning customer;
- cancellation and refund status;
- margin where available; and
- lead or assisted-sale indicator for orders closed outside a normal online session.
This table tells you what the business booked. It does not, by itself, tell you which touchpoint deserves credit.
Use order ID to deduplicate claims across systems whenever integrations permit.
Step 2: Audit collection before comparing attribution
Check:
- purchase fires once per completed order;
- order value and currency match the backend;
- test and cancelled orders are handled consistently;
- Meta Pixel and Conversions API do not double count;
- Google Ads and GA4 import rules are understood;
- UTMs survive redirects and checkout;
- cross-domain and payment-domain tracking is configured;
- consent behavior is documented;
- timestamps and timezones align; and
- product IDs match catalogs.
If the underlying order and event counts are unhealthy, changing attribution models only changes the presentation of bad data.
Step 3: Document every attribution setting
Create a one-page measurement contract.
| System | Primary job | Attribution rule/window | Revenue basis | Known blind spots |
|---|---|---|---|---|
| Shopify | Orders, refunds, customer record | Platform path logic | Backend booked/net revenue | Cross-device and offline influence |
| Meta | Optimize Meta delivery | Record current click/view settings | Platform-reported value | Overlap with other channels and modeled data |
| Google Ads | Optimize Google campaigns | Record current conversion and window settings | Platform-reported value | Overlap and imported-conversion differences |
| GA4 | On-site acquisition and path diagnostics | Record current model and lookback | Analytics event value | Consent loss, blockers, identity gaps |
| ESP | Optimize campaigns and flows | Record open/click rules and window | ESP-attributed value | Overlap with ads and limited anonymous coverage |
| Cross-channel attribution | Compare connected journeys | One consistent model/window | Deduplicated order value | Unobserved/offline influence remains |
Record changes with an effective date. Otherwise a dashboard shift can look like a performance shift.
Step 4: Use three measurement lenses
Lens A: Blended business performance
Track total marketing spend against backend revenue, contribution margin, and new-customer outcomes.
Useful metrics include:
- blended MER;
- blended CAC;
- new-customer CAC;
- contribution margin after ad spend;
- cancellation and return rate; and
- payback or repeat revenue where relevant.
This lens keeps channel claims from exceeding business reality.
Lens B: Consistent journey attribution
Apply one set of identity, window, and model rules across observable touchpoints. Compare first touch, last non-direct touch, and a multi-touch or modeled view to understand discovery, assistance, and conversion.
The point is not to declare one model objectively true. It is to see whether a decision changes under reasonable lenses.
If Meta looks valuable only under its own view-through report but not in any connected journey, blended trend, customer survey, or experiment, investigate before scaling. If branded search captures most last clicks while upper-funnel spend and new demand move together, do not automatically cut discovery.
Lens C: Incrementality
Attribution observes relationships. Incrementality asks what would not have happened without the marketing.
Use practical tests such as:
- geographic holdouts;
- audience holdouts;
- campaign pauses where seasonality is controlled;
- matched-market comparisons;
- conversion-lift studies; and
- post-purchase “How did you first hear about us?” responses as a directional companion.
High-ticket furniture may have lower order volume, so tests need enough time and careful design. Do not overreact to a handful of purchases.
How to interpret Direct and branded search
Direct is often a return path, not a discovery channel. It can also include missing referrers, untagged links, privacy loss, bookmarks, copied URLs, or cross-device return visits.
Branded search frequently closes demand created elsewhere. That does not make it worthless: it may protect the brand, retrieve a shopper efficiently, or capture comparison intent. But last-click branded performance should not automatically receive all discovery credit.
For furniture, examine journeys by days to purchase and number of sessions. Compare:
- first-touch source;
- final non-direct source;
- assisting channels;
- view and click interactions;
- product and order value;
- new versus returning customer; and
- geography or store/showroom influence where available.
How to handle assisted and offline orders
High-value furniture purchases may close after a phone call, consultation, quote, trade conversation, or showroom visit. Some orders genuinely have no recoverable online session.
Create explicit fields for:
- consultation requested;
- quote created;
- swatch or sample requested;
- showroom appointment;
- phone-assisted order;
- salesperson or partner referral; and
- online order ID when the sale later completes.
Do not invent a digital path when none exists. Connect lead and order records when reliable identifiers and permission allow; otherwise report the order as assisted or unattributed and keep it visible in the total.
A weekly budget decision table
For each channel, review:
| Question | Evidence |
|---|---|
| Is it creating qualified demand? | New visitors, engaged product views, swatch/consultation requests, first-touch journeys |
| Is it assisting evaluation? | Repeat visits, product comparisons, delivery checks, email engagement, assisted paths |
| Is it closing demand? | Last non-direct orders, checkout completion, branded retrieval |
| Is the business outcome healthy? | Backend net revenue, new customers, margin, cancellations, returns |
| Is the effect likely incremental? | Holdout/lift result, blended trend, customer response |
| Is tracking healthy? | Event reconciliation, UTM coverage, deduplication, consent/identity diagnostics |
Then assign a decision: scale, hold, repair measurement, change creative/landing page, or reduce. Do not move budget solely because one platform changed its claimed ROAS.
Common mistakes
Adding platform conversions together
This double counts overlapping claims. Use backend orders for the total and platform conversions for platform-specific optimization.
Calling one system “the truth” for every decision
The backend is authoritative for transactions, not necessarily for complete marketing influence. Platform reports are useful within their systems, not as a deduplicated cross-channel total.
Changing windows until the answer looks good
Choose windows based on observed time to purchase and business use. Document them and compare periods consistently.
Ignoring returns and cancellations
Furniture damage, delivery failure, and fit can reverse revenue. Optimize toward net, valuable orders where possible.
Assuming untracked means uninfluenced
Some influence is not observable. State the blind spot and use experiments rather than filling it with certainty.
A 30-day implementation plan
Week 1: Reconcile transactions
- Match backend orders with GA4 and ad-platform purchase events.
- Fix duplicate purchases, currency, timezone, and order-ID problems.
- Separate gross revenue, net revenue, and refunds.
Week 2: Standardize acquisition data
- Adopt a UTM naming convention.
- Audit redirects, checkout, cross-domain behavior, and payment providers.
- Document every platform window and conversion action.
Week 3: Build the decision view
- Create blended business metrics.
- Add first-touch, last non-direct, and connected journey lenses.
- Segment by product category, order value, new/returning customer, and time to purchase.
Week 4: Validate a real decision
- Choose one material budget question.
- Form a hypothesis before looking at a preferred dashboard.
- Use the three lenses and design a holdout or matched comparison.
- Record the decision, expected result, and review date.
Build a view that supports decisions
Attribution will not make every dashboard agree, and it cannot observe every household conversation or showroom visit. It can make the disagreements explainable and the budget process more disciplined.
Explore Full Impact to see how Attribuly connects ad views, clicks, on-site behavior, and purchases under a consistent journey framework.
Editorial research basis
FAQs
Why do Meta, Google, GA4, and Shopify report different furniture sales?
Which source should a furniture brand use for revenue?
Should platform-reported conversions be added together?
How should a furniture brand choose an attribution window?
About Attribuly
Attribuly helps DTC brands recover abandoned cart revenue. We identify anonymous visitors and existing subscribers your ESP (like Klaviyo) missed, enrich their profiles, and feed the signals back — so your abandonment flows fire and your retargeting audiences grow, and you recover at least 15% more revenue. Shopify featured app, Klaviyo tech partner. Trusted by 20,000+ brands. Guaranteed 4× ROI.