
What Is a Good New Customer CPA for Your Ecommerce Store?
A $40 New Customer CPA can be excellent for one store and unsustainable for another. Compare NC-CPA percentiles by AOV cohort ($55–$130 median $34.95; above $600 median $277.65) and learn where your store stands against comparable brands.
Related articles
TL;DR
- New Customer CPA (NC-CPA) measures the paid-media cost required to acquire one first-time customer. Repeat orders do not count as new-customer acquisition.
- Lower is better, but there is no universal good NC-CPA. A store selling $35 products should not be compared with a store selling $800 products.
- Attribuly groups stores into five AOV cohorts. In the current benchmark, median NC-CPA ranges from $34.95 for stores with $55–$130 AOV to $277.65 for stores above $600 AOV.
- P50 is the cohort median. Because NC-CPA is a cost metric, a store at or below P25 is in the top-performing quarter; a store above P75 is in the higher-cost quarter.
- Selecting an AOV reveals the public distribution. Connecting your store and ad accounts reveals your own 28-day NC-CPA, percentile, and channel-level comparison.
What is a good New Customer CPA?
> Direct answer: A good New Customer CPA is one that is at or below the median for stores in your AOV cohort and still fits your margin, repeat-purchase rate, and payback target. At or below P25 means your acquisition cost is in the top-performing quarter of comparable stores. Lower is better.
That answer is more useful than a single universal target because customer economics change with order value. Paying $70 to acquire a customer may be dangerous when the first order is worth $45. The same $70 may be efficient for a brand with a $240 AOV, strong gross margin, and reliable repeat purchase.
What does New Customer CPA mean?
New Customer CPA is the amount of attributed paid-media spend required to acquire one first-time customer. It separates acquisition from retention by excluding repeat purchases from the conversion count.
In plain language, it answers:
> What did we pay in advertising to acquire each new customer during the last 28 days?
The basic formula is:
New Customer CPA = attributed paid-media spend ÷ attributed first-purchase conversionsNew Customer CPA vs. CPA vs. CAC
| Metric | What it counts | What it helps answer |
|---|---|---|
| New Customer CPA | Paid-media spend and attributed first purchases | What did advertising cost us for each newly acquired customer? |
| Total CPA | Paid-media spend and all attributed conversions, including repeat purchases | What did each attributed conversion cost overall? |
| CAC | Often includes a wider set of acquisition costs, such as media, agency fees, creative, salaries, and software | What did the business spend in total to acquire each new customer? |
New Customer CPA and CAC are sometimes used interchangeably, but they should not be assumed to match. Attribuly's NC-CPA benchmark uses paid-media spend so stores are compared on a consistent basis.
If you need definitions for CPA, CPC, CPM, CTR, CVR, ROAS, and related terms, use Attribuly's plain-English attribution metrics guide.
Why should New Customer CPA be compared by AOV?
Average order value changes how much acquisition cost a store can absorb. That makes AOV a practical first filter for peer comparison.
A universal ecommerce average would combine businesses with completely different economics: low-ticket consumables, mid-market DTC products, premium equipment, and four-figure products. The resulting median might be mathematically correct and operationally useless.
Attribuly therefore assigns each store to one of five AOV cohorts:
- Below $55
- $55–$130
- $130–$260
- $260–$600
- Above $600
For benchmark grouping, AOV represents the typical order value over the rolling period. The goal is not to say that AOV alone determines a healthy acquisition cost. It is to avoid comparing stores whose basic order economics are too different to produce a useful reference point.
New Customer CPA benchmarks by AOV
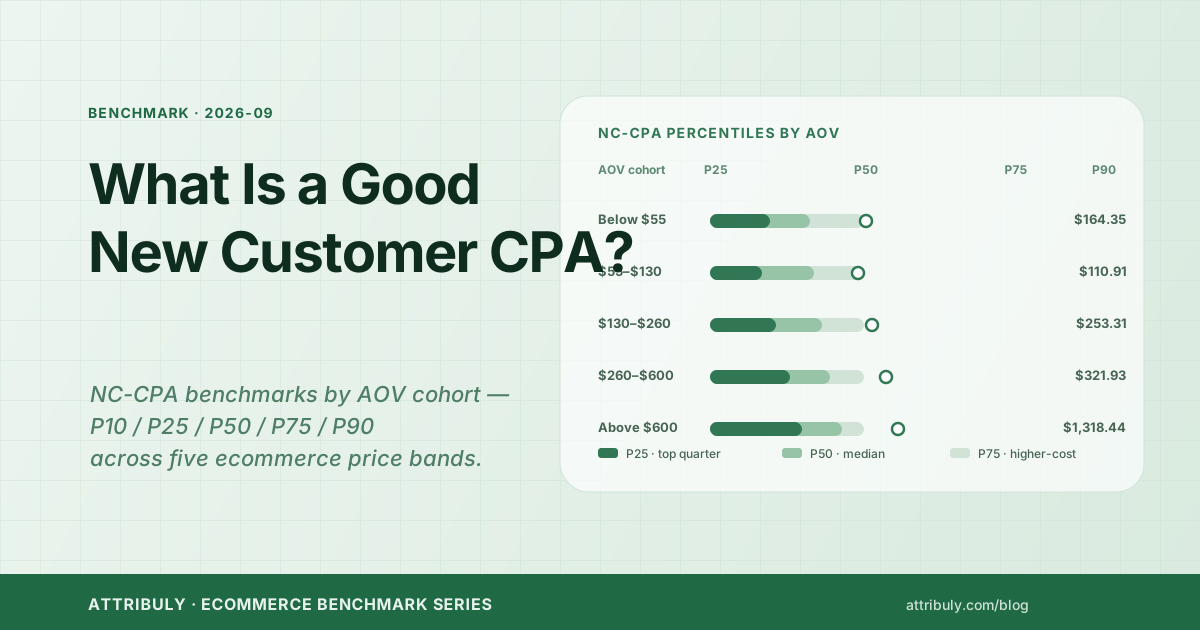
The table below shows Attribuly's current aggregated and anonymized NC-CPA percentile thresholds. Currency values are rounded to two decimals for display.
| AOV cohort | P10 | P25 | P50 median | P75 | P90 |
|---|---|---|---|---|---|
| Below $55 | $9.57 | $22.82 | $38.75 | $94.98 | $164.35 |
| $55–$130 | $9.35 | $17.54 | $34.95 | $53.05 | $110.91 |
| $130–$260 | $22.02 | $46.76 | $86.20 | $117.14 | $253.31 |
| $260–$600 | $52.44 | $109.43 | $137.15 | $221.54 | $321.93 |
| Above $600 | $110.70 | $183.03 | $277.65 | $395.84 | $1,318.44 |
How to read this table: Lower NC-CPA is better. P10 is the cost threshold that 10% of stores fall at or below. P25 marks the top-performing quarter. P50 is the median. P75 and P90 mark progressively higher-cost positions.
These percentiles are descriptive benchmarks, not promises or universal budget rules. They show where eligible stores in the same AOV range currently fall; they do not replace a store's margin, LTV, cash-flow, or incrementality analysis.
What do P10, P25, P50, P75, and P90 mean?
Percentiles answer “where does this value sit in the distribution?”
Because New Customer CPA is a cost metric, the interpretation runs in the opposite direction from a score where higher is better:
| Threshold | Interpretation for NC-CPA |
|---|---|
| At or below P10 | Among the lowest-cost 10% of stores in the cohort |
| At or below P25 | In the top-performing 25% by acquisition cost |
| P50 | The cohort median: half of stores are at or below this value |
| Above P75 | In the higher-cost quarter of the cohort |
| Above P90 | Among the highest-cost 10% of stores in the cohort |
Suppose a store has an AOV of $90 and a New Customer CPA of $48. It belongs in the $55–$130 cohort. Its cost is above the $34.95 median but below the $53.05 P75 threshold. That places it in the middle 50%—not a crisis, but a useful signal to inspect margin and channel-level gaps.
How does Attribuly calculate New Customer CPA?
Attribuly uses one consistent methodology so the store result and peer benchmark are comparable.
- Only first purchases count. Repeat orders are excluded from the new-customer conversion count.
- The window covers the latest 28 days. It rolls forward and is anchored to the order date.
- Paid-media spend only. The calculation uses eligible advertising spend from supported paid channels; affiliate payouts are excluded.
- Full Impact attribution is used. The benchmark uses a 30-day click window and a 1-day view window with the approved position-based credit logic across first, last, and middle touches.
- Cancelled and fully refunded orders are removed. Partial refunds remain in the current loose-filter methodology.
- Purely organic first purchases are excluded. A first purchase needs eligible advertising attribution credit to enter the NC-CPA calculation.
- No new-customer conversion means no value. If the denominator is zero, the result is shown as
—, not $0.
Attribuly materializes the calculation daily and distributes eligible spend across attributed first-purchase paths. That makes the overall number traceable to channel, campaign, ad set, and ad-level evidence rather than treating every platform-reported conversion as equally valid.
For a deeper look at how views and clicks are evaluated, read View + Click Attribution: the Full Impact model.
Why channel-level NC-CPA can tell a different story
An overall NC-CPA can look acceptable while one channel is substantially above its peer median. The blended number hides that gap.
After a store connects its supported ad accounts, Attribuly shows:
- Overall New Customer CPA
- The store's percentile within its AOV cohort
- The cohort median and distribution
- Google, Meta, TikTok, and Bing comparisons where eligible data is available
- The channel with the largest meaningful gap
The point is not to pause a channel just because it sits above a benchmark. The point is to know where to investigate first. A high channel NC-CPA may reflect weak prospecting, poor landing-page fit, a long consideration cycle, incomplete signals, or a channel playing an upper-funnel role that last-click reporting undervalues.
Connect your store to reveal your overall and channel position →
How should you use an NC-CPA benchmark?
Use the benchmark as a decision aid, not an automatic verdict.
1. Start with the correct AOV cohort
Choose the range that reflects your typical order value. Comparing against the wrong cohort can make an efficient result look expensive—or an unsustainable result look normal.
2. Find your position before changing spend
Determine whether your store is below P25, near P50, or above P75. The distance from the cohort median is often more actionable than the raw number alone.
3. Compare the result with your unit economics
Ask whether the acquisition cost fits:
- Gross margin on the first order
- Contribution margin after fulfillment and discounts
- Expected repeat-purchase rate
- LTV and payback period
- Cash-flow tolerance
A store can beat the cohort median and still lose money. Another can sit above the median and remain healthy because its margins and repeat-purchase economics are stronger.
4. Drill down by channel
Look for the largest gap between your channel NC-CPA and the available peer median. Then inspect campaigns, audience mix, landing pages, creative, and attribution paths before making a budget decision.
5. Track the direction over time
A single percentile is a snapshot. The more useful question is whether your NC-CPA is moving toward or away from the healthy range while spend scales.
Common mistakes when reading an NC-CPA benchmark
Treating the median as a universal target
P50 is a peer reference, not a profitability threshold. Your actual ceiling depends on margin, LTV, and payback.
Comparing NC-CPA with total CPA
Total CPA includes repeat conversions and is often lower for stores with strong retention. It should not be compared directly with a first-purchase-only benchmark.
Assuming a high percentile means better performance
For a cost metric, higher is worse. “84th percentile” can be ambiguous, so the product should state the direction explicitly—for example, “Your NC-CPA is higher than 84% of similar stores.”
Acting on a channel with too little data
A median built from a very small channel sample can be volatile. Treat sparse comparisons as directional or withhold them until the eligibility threshold is met.
Ignoring the attribution model
Two dashboards can report different NC-CPA values because they use different windows, touchpoint credit, view-through logic, and order filters. Align the methodology before comparing the numbers.
What happens after you connect your store?
The public benchmark lets you select an AOV and inspect the cohort distribution without signing up. To see your own position, register and connect Shopify plus at least one supported ad account.
Attribuly then calculates your eligible 28-day NC-CPA automatically and places it inside the matching cohort. Your individual result is not exposed to other merchants. Peer figures are aggregated and anonymized.
You can also invite teammates to review the benchmark in the workspace without an additional seat fee. From the same workspace, the team can inspect the User Journey Map and Full Impact Attribution to understand the path from ad exposure or click to purchase.
NC-CPA is the first metric in Attribuly's free benchmark series. Planned additions include CPC, CTR, CPM, CVR, and ROAS. The benchmark metrics are intended to remain free for every Attribuly merchant, without requiring a paid plan.
See where your store stands
A standalone NC-CPA number cannot tell you whether acquisition is efficient. A relevant cohort gives it context; your own unit economics tell you what to do next.
Choose your AOV to see the public distribution. Then connect your accounts to reveal your store's New Customer CPA, percentile, and biggest channel gap.
FAQs
What is New Customer CPA?
What is a good New Customer CPA for ecommerce?
Is a lower New Customer CPA always better?
Why does Attribuly group benchmarks by AOV?
Does New Customer CPA include repeat purchases?
Does the benchmark include affiliate commissions?
Do I need to register to see the benchmark?
Sources
- Attribuly, NC-CPA Benchmark v0 methodology and approved AOV cohort data, updated September 2026. First-party product and data documentation.
- Attribuly Help Center, View + Click Attribution: the Full Impact model.
- Attribuly, Attribution Metrics: Definitions for ROAS, CPA, Conversion Value, CPM, CTR.
- Attribuly, Full Impact feature overview.
About Attribuly
Attribuly helps DTC brands recover abandoned cart revenue. We identify anonymous visitors and existing subscribers your ESP (like Klaviyo) missed, enrich their profiles, and feed the signals back — so your abandonment flows fire and your retargeting audiences grow, and you recover at least 15% more revenue. Shopify featured app, Klaviyo tech partner. Trusted by 20,000+ brands. Guaranteed 4× ROI.