
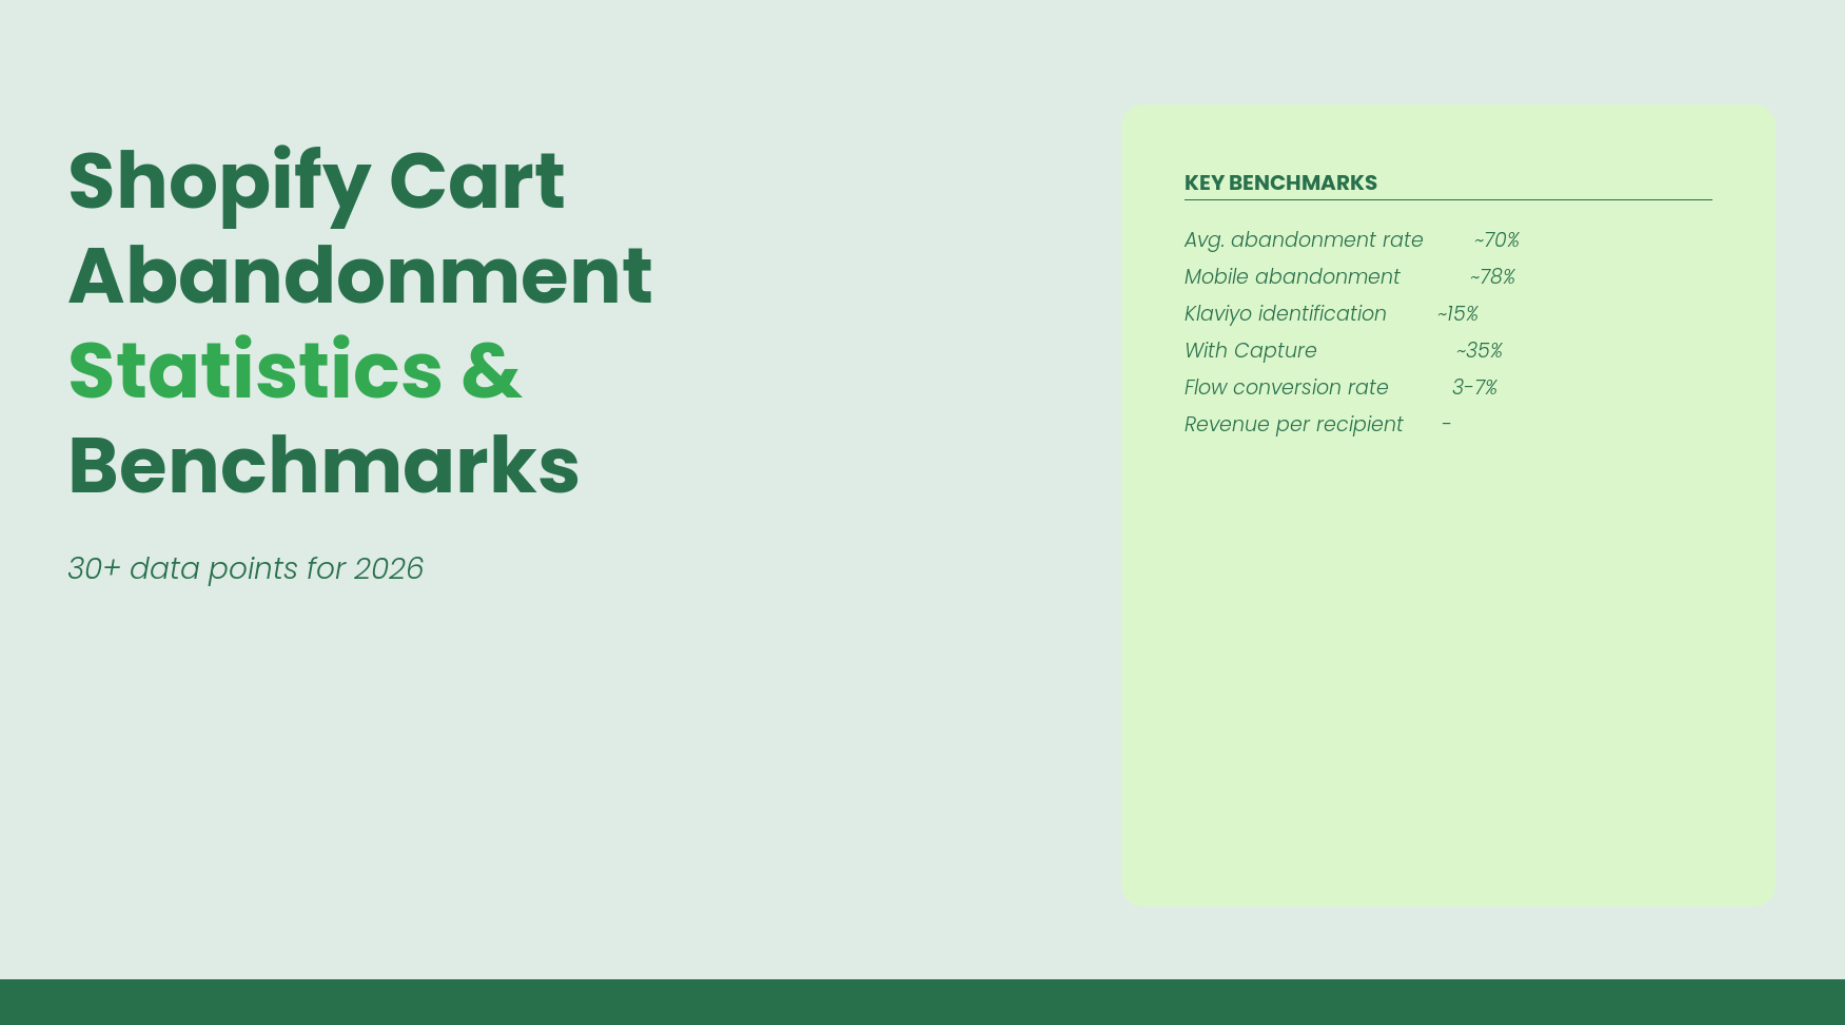
Shopify Cart Abandonment Statistics and Benchmarks (2026)
30+ data points on cart abandonment rates, recovery benchmarks, and identification coverage — compiled for Shopify and DTC brands making decisions about their recovery strategy in 2026.
Related articles
TL;DR
- The average online cart abandonment rate is approximately 70%. Mobile abandonment is higher (approximately 76-80%) than desktop (approximately 60-65%).
- The top reason for abandonment is unexpected costs (48%), followed by required account creation (26%) and complicated checkout (22%).
- Klaviyo's abandoned cart flow is the highest-revenue email automation, averaging nearly $3 per recipient.
- However, Klaviyo natively identifies only about 15% of cart abandoners. The remaining 85% receive no recovery email.
- Visitor identification tools can expand recoverable abandoners to 25-35%, potentially doubling recovered revenue.
Cart abandonment rate statistics
Overall abandonment rates
- The average online shopping cart abandonment rate is approximately 69.8-70% across all industries and devices.
- This means roughly 7 out of 10 shoppers who add a product to their cart do not complete the purchase.
- Cart abandonment rates have remained relatively stable over the past decade, ranging between 68-72%.
Abandonment by device
| Device | Approximate abandonment rate |
|---|---|
| Mobile | 76-80% |
| Tablet | 70-72% |
| Desktop | 60-65% |
Mobile has the highest abandonment rate, likely due to smaller screens, slower loading, and less convenient payment entry. Mobile also accounts for over 70% of Shopify store traffic, making it the largest contributor to total abandoned carts.
Abandonment by industry
| Industry | Approximate abandonment rate |
|---|---|
| Travel | 80-85% |
| Fashion / Apparel | 68-72% |
| Consumer electronics | 74-78% |
| Health / Beauty | 65-70% |
| Home / Garden | 70-75% |
| Food / Grocery | 55-60% |
| Jewelry / Luxury | 75-80% |
Higher-AOV and higher-consideration industries tend to have higher abandonment rates because shoppers spend more time researching and comparing.
Why shoppers abandon their carts
Top reasons for cart abandonment
| Reason | % of abandoners who cited this reason |
|---|---|
| Unexpected shipping costs, taxes, or fees | 48% |
| Just browsing / not ready to buy | 34% |
| Comparing prices across sites | 27% |
| Required to create an account | 26% |
| Checkout process too complicated | 22% |
| Could not see total cost upfront | 21% |
| Delivery too slow | 18% |
| Did not trust site with payment info | 17% |
| Website errors or crashes | 13% |
| Return policy not satisfactory | 12% |
| Preferred payment method not available | 9% |
Source: Compiled from Baymard Institute research and industry surveys.
Key insight from this data
The #1 reason (unexpected costs, 48%) is fully preventable through transparent pricing. The combined "just browsing" + "comparing prices" segment (34% + 27%) is not preventable but is recoverable through email follow-up.
Recovery and email statistics
Klaviyo abandoned cart flow benchmarks
| Metric | Industry average | Top performers |
|---|---|---|
| Flow conversion rate (orders/recipients) | 3-4% | 5-7% |
| Average revenue per recipient | $2-$3 | $3-$5 |
| Email 1 open rate | 40-50% | 55-65% |
| Email 1 click rate | 5-8% | 10-15% |
| Optimal send timing (Email 1) | 1-4 hours | 1-2 hours |
| Optimal flow length | 3 emails | 3-4 emails |
Email recovery revenue contribution
- Abandoned cart flows contribute an average of 3-8% of total ecommerce revenue for brands with well-optimized Klaviyo setups.
- For brands with visitor identification active, this contribution can increase to 8-15% because more abandoners enter the flow.
- Email marketing overall (all flows + campaigns) typically contributes 20-30% of total Shopify store revenue.
Identification and coverage statistics
The identification gap
| Metric | Typical value |
|---|---|
| Total visitors who add to cart | 100% |
| Visitors who abandon cart | ~70% |
| Abandoners Klaviyo can identify (native) | ~15% of abandoners |
| Abandoners who receive no recovery email | ~85% of abandoners |
| Abandoners identifiable with visitor ID tools | 25-35% of abandoners |
What the identification gap costs
For a Shopify store with these characteristics:
- 10,000 monthly add-to-cart sessions
- 70% abandonment rate = 7,000 abandoners
- $100 AOV
- 4% flow conversion rate
| Scenario | Identified abandoners | Recovered orders | Recovered revenue |
|---|---|---|---|
| Klaviyo only (15%) | 1,050 | 42 | $4,200/month |
| Klaviyo + visitor identification (35%) | 2,450 | 98 | $9,800/month |
| Difference | +1,400 | +56 | +$5,600/month |
The incremental $5,600/month comes from identifying shoppers who were previously invisible to Klaviyo. The emails themselves do not change — only the audience size changes.
Mobile commerce statistics
| Metric | Value |
|---|---|
| Mobile share of Shopify traffic | 70-75% |
| Mobile share of Shopify orders | 55-60% |
| Mobile conversion rate | 1.5-2% (vs 3-4% desktop) |
| Mobile cart abandonment rate | 76-80% |
Key insight
Mobile has the majority of traffic but a lower conversion rate and higher abandonment rate. This means the majority of abandoned carts come from mobile sessions — making mobile checkout optimization critical for reducing abandonment, and email recovery critical for the carts that are still abandoned.
Checkout optimization statistics
| Optimization | Estimated impact on conversion |
|---|---|
| Enabling guest checkout | +5-10% checkout conversion |
| Adding Shop Pay | +36-50% checkout conversion (Shopify data) |
| One-page checkout | +10-15% checkout conversion |
| Adding PayPal/Apple Pay | +5-10% checkout conversion |
| Adding BNPL (Afterpay/Klarna) | +10-20% for products $100+ |
| Showing shipping cost on product page | -5-10% abandonment rate reduction |
Recovery timing statistics
| Recovery method | Timing | Typical effectiveness |
|---|---|---|
| Push notification | Within 1 hour | Highest open rate, but requires app install |
| Email 1 | 1-4 hours | Best balance of urgency and reach |
| SMS reminder | 2-6 hours | High open rate (90%+), but requires opt-in |
| Email 2 | 24 hours | Catches "got distracted" shoppers |
| Retargeting ad | 1-3 days | Broad reach, lower conversion than email |
| Email 3 | 48-72 hours | Last push, may include incentive |
| Direct mail | 5-10 days | Highest cost, best for high-AOV items |
Key insight
The first 4 hours after abandonment is the highest-conversion window. Recovery emails sent within this window see the best performance. After 72 hours, effectiveness drops significantly for low-AOV products but remains meaningful for high-AOV products with longer decision cycles.
How to use these statistics
For benchmarking your store
Compare your Shopify store's metrics against these benchmarks:
- Cart abandonment rate: If higher than 75%, focus on checkout optimization (preventable reasons).
- Identification coverage: If Klaviyo reaches fewer than 20% of abandoners, add visitor identification.
- Flow conversion rate: If below 3%, optimize email content, timing, and segmentation.
- Revenue per recipient: If below $2, your emails may lack compelling content or product focus.
For building a business case
Use the identification gap calculation to estimate the revenue impact of adding visitor identification:
Additional identified abandoners = Monthly abandoners × (new coverage % - current coverage %)
Additional recovered orders = Additional identified × flow conversion rate
Additional revenue = Additional recovered orders × AOV
Methodology and sources
This compilation draws from the following sources:
- Baymard Institute: Cart abandonment rate research and reasons
- Klaviyo: Flow performance benchmarks
- Shopify: Checkout conversion and Shop Pay data
- Statista: Ecommerce and mobile commerce statistics
- Attribuly: Identification coverage data and customer case studies
Individual statistics are approximations based on publicly available research. Exact figures vary by store, industry, geography, and time period. Statistics marked "approximate" reflect ranges reported across multiple sources.
This article will be updated periodically as new data becomes available. Last data review: June 2026.
Next step
Compare your store's cart abandonment rate and recovery coverage against these benchmarks. If your Klaviyo flow reaches fewer than 20% of your abandoners, visitor identification is the highest-impact improvement available.
→ Start free trial → Learn more about Capture
FAQs
What is the average Shopify cart abandonment rate?
What is the #1 reason shoppers abandon their carts?
How much revenue can abandoned cart recovery generate?
Is mobile abandonment higher than desktop?
How does visitor identification affect recovery revenue?
When is the best time to send a cart recovery email?
About Attribuly
Attribuly helps DTC brands recover abandoned cart revenue. We identify anonymous visitors and existing subscribers your ESP (like Klaviyo) missed, enrich their profiles, and feed the signals back — so your abandonment flows fire and your retargeting audiences grow, and you recover at least 15% more revenue. Shopify featured app, Klaviyo tech partner. Trusted by 20,000+ brands. Guaranteed 4× ROI.