
In low-AOV, the most expensive thing isn’t spend — it’s the budget you lose every week to noise and conflicting definitions.
The campaign “wins” on Monday, looks different by Thursday, and turns into a reconciliation war by Friday. Attribuly helps you clean signals, unify attribution views, and turn weekly reporting into a repeatable decision loop — starting with time saved.
Fast setup • Cleaner signals • Built for weekly decision loops

The 3 moments that steal your week
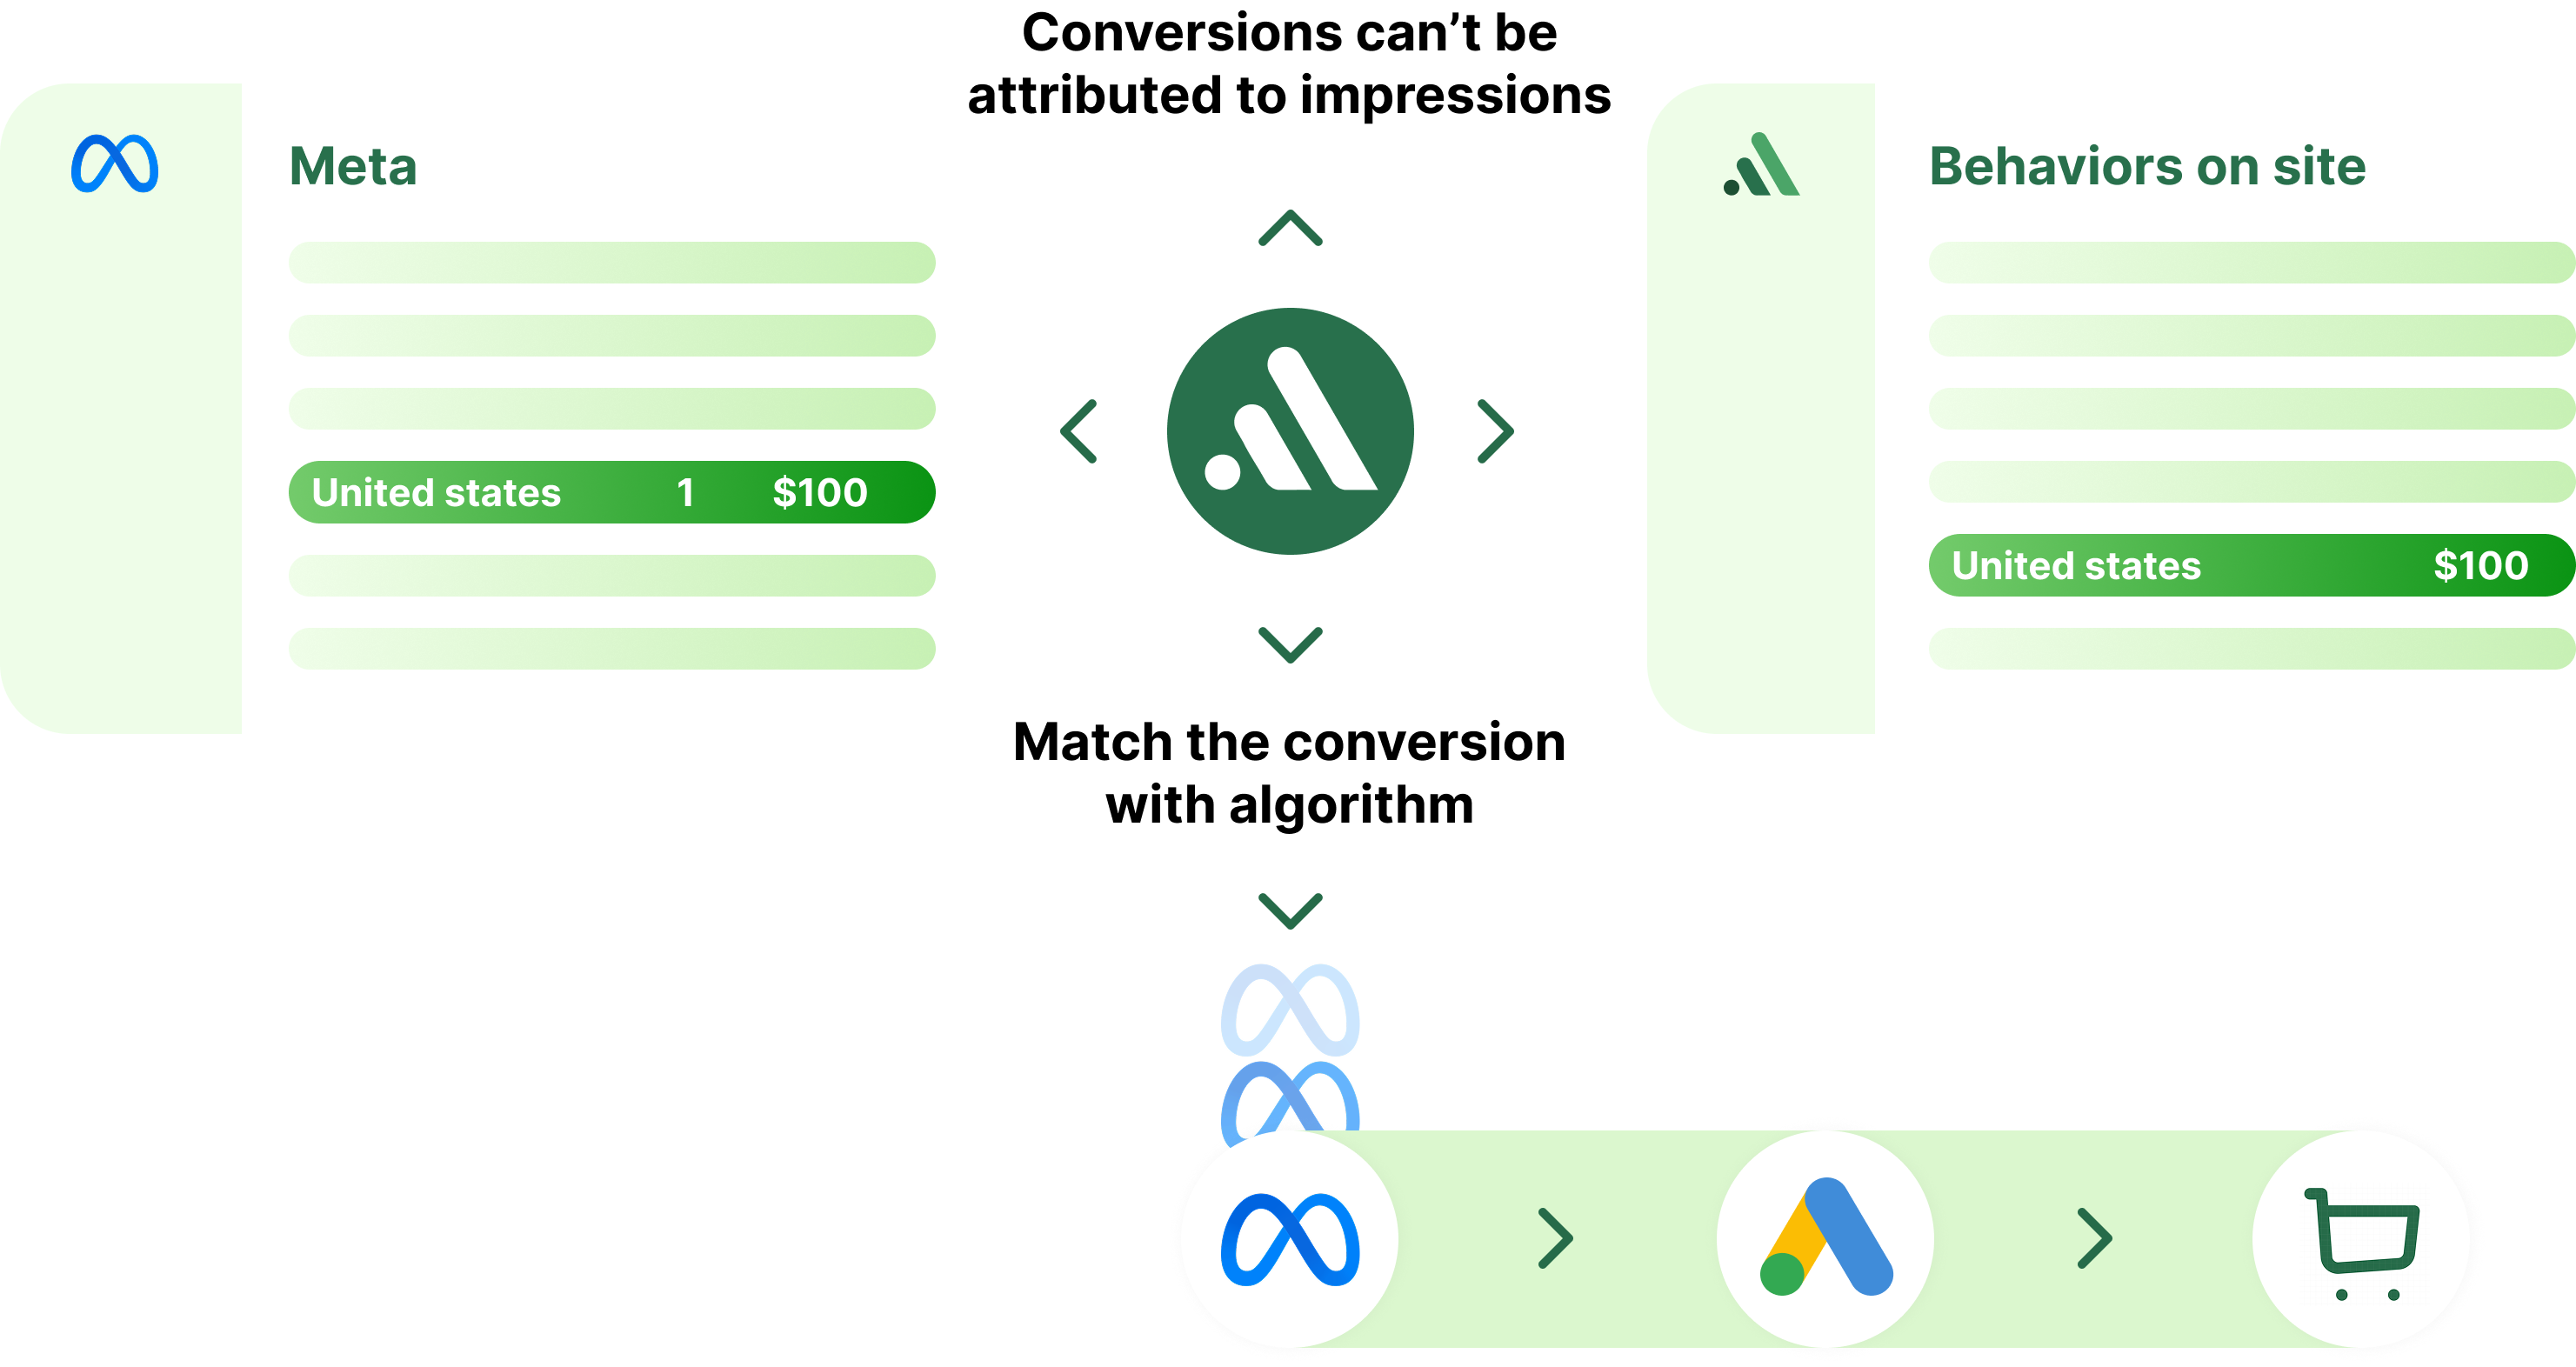
The promo “win” that disappears after attribution shifts
Numbers change as platforms dedupe, attribution windows differ, and channels fight for credit.
More channels, more touchpoints — more argument, less action
Short video, affiliates, search, email, remarketing… when each tool tells a different story, the team can’t move.
Missing or duplicated events silently break platform learning
When signals are noisy, optimization drifts. You end up “fixing” performance by spending more — not by getting smarter.
Why low-AOV becomes reporting hell
Because the pace is fast — and noise overwhelms causality.
Frequent promos and dense product catalogs create constant variance.
View-through and assist touchpoints often get miscredited, pushing budget toward the wrong “answer.”
Without clean, deduped signals, every weekly review starts with reconciliation instead of decisions.
Before measurement becomes reliable, you don’t lack effort — you lack a stable decision view
How Attribuly fixes it (in 4 steps)
1) Unified view: stop arguing with numbers
Compare attribution views side-by-side so weekly decisions stop depending on one biased report.
2) Clean signals: dedupe and restore trust
Use privacy-safe tracking and clean event definitions so platform learning doesn’t drift on noisy data.
3) Diagnose weekly: pick the right bottleneck
Let AllyClaw surface priorities so you always know what to fix first — with a clear why.
4) Action loop: write decisions, validate next week
Turn the weekly review into a one-page memo: scale/cut/test — with the metric you’ll validate.
What changes after you implement it
Two case stories

Case 1 — Beauty & fast-moving goods: “watched, didn’t click” short video
- Use Full Impact vs last-click contrast to reveal assist contribution.
- Clean event signals so deduping doesn’t rewrite the story every Thursday.
- Standardize a weekly memo: 3 actions + the metric to validate next week.
- Short video became explainable and testable, not a black box.
- Weekly review shifted from “who gets credit” to “what we do next.”
- Run Full Impact vs last-click side-by-side before reallocating budget.
- Write one validation metric per action (and check it next week).

Case 2 — Daily essentials: too many SKUs, no combination analysis
- Integrate dozens of marketing touchpoints under one attribution logic.
- Keep identities and orders connected so segmentation isn’t rebuilt every week.
- Review two segmentation cuts weekly (e.g., SKU group × channel) to guide actions.
- Combination analysis became practical, enabling stable, fine-grained operations.
- The team stopped guessing and started iterating with confidence.
- Unify customer + order + touchpoints first, then segment.
- Pick 2 cuts per week and write the decision you’ll validate.
Playbook checklist you can copy
- Align event definitions and dedupe rules across tools.
- Verify collection for View Product / Add to Cart / Purchase.
- Set a baseline contrast (Full Impact vs last-click).
- Run weekly diagnosis and choose 3 priority actions.
- Map each action to one validation metric for next week.
- Fix the biggest signal issue before debating ROI.
- Document a weekly memo template (scale/cut/test + why).
- Add guardrails for experiments so variance doesn’t derail learning.
- Onboard new teammates with the same decision loop.
FAQ
Ready to turn weekly reconciliation into a weekly action loop?
Start with the checklist, then make decisions repeatable — week after week.