
How to Connect Spend, Engagement Rate, and Revenue With Web Analytics
Learn a practical web analytics framework to diagnose performance using spend, unique users, engagement rate, add to cart, purchases, and revenue—then decide what to fix before changing budget.
Related articles
TL;DR
- Don’t diagnose performance with one metric. Use a chain that connects spend, traffic quality, funnel behavior, and revenue.
- A consistent read order prevents “channel reporting” from hiding campaign and landing page issues.
- Use UTM campaign and landing page breakdowns to isolate what changed before you change budget.
- When signals disagree (e.g. high engagement but low purchases), prioritize funnel fixes before scaling spend.
Most marketing teams don’t lose money because they lack dashboards. They lose money because they treat every dashboard as a different truth.
You might see spend rising in your ads manager, a stable engagement rate in web analytics, and inconsistent revenue numbers in attribution reporting. Then the debate starts: “Is traffic quality worse?” “Is the landing page broken?” “Should we cut budget?”
This article gives you a practical web analytics framework that turns channel data into action. It is built around a simple idea: you can’t diagnose performance with one metric. You need a chain that connects cost, traffic quality, funnel behavior, and revenue.
Why channel reporting leads teams to the wrong conclusion
Channel analysis often fails for predictable reasons:
- The dimension changes without you noticing. A channel view tells a different story than a UTM campaign view.
- The denominator changes. A purchase rate can fall because unique users surged with low-intent traffic, not because your funnel got worse.
- You read outcomes without reading the path. Revenue is the outcome, but the explanation is usually in product views, add to cart, and checkout behavior.
The fix is not “more charts.” The fix is a consistent read order.
A four-layer web analytics framework that holds up under pressure
Think of your reporting as four layers. Each layer answers a different question. You only move to the next layer after the current one makes sense.
Layer 1: Cost and scale
Start with cost and scale, because it sets the context for everything else.
- Spend answers how much you paid to create traffic.
- Unique users answers how many distinct people your marketing reached on-site.
- Returning users helps separate repeat demand from net-new reach.
- Total sessions explains whether the same people are coming back multiple times.
If spend rose but unique users did not, you may have a pricing problem upstream. If unique users rose sharply, you may have a targeting problem downstream.
Layer 2: Traffic quality
Next, check whether people behaved like they intended to buy.
- Engagement rate is a useful signal of quality when interpreted alongside sessions.
- Events per session helps you tell the difference between “bounced traffic” and “curious traffic.”
- Homepage views and product views can reveal whether people reached your store and explored it.
A common trap is to treat engagement rate as “good enough” and stop there. A healthy engagement rate can still hide a broken product funnel.
Layer 3: Funnel behavior
Now look at what matters for ecommerce outcomes.
- Add to cart is a strong proxy for product-market match at the page level.
- Purchases is the final outcome, but it is a lagging indicator.
- Purchase rate helps normalize purchases against traffic volume.
If add to cart is healthy but purchases are not, friction is likely happening later. If add to cart is weak, the issue is earlier: product page clarity, price positioning, offer, or audience mismatch.
Layer 4: Revenue and efficiency
Finally, evaluate revenue, then decide whether to calculate ROAS.
- Revenue is what you are ultimately trying to grow.
- If you want efficiency, you compare revenue against spend to understand return.
Do this last, not first. Revenue without funnel context is how teams overreact to noise.
How to diagnose the problem before you change budget
Here is the diagnostic sequence that reduces false moves.
Diagnose the layer that changed first
When results shift, ask which layer changed first:
- Spend changed first, everything else followed. This suggests channel mix or bidding changes.
- Unique users changed first, then purchases. This suggests audience quality or traffic sources changed.
- Product views changed first, then add to cart. This suggests landing page routing, merchandising, or tracking changes.
- Add to cart changed first, but traffic stayed stable. This suggests pricing, page speed, variant selection, or offer issues.
This is why a web analytics view that includes both engagement rate and add to cart is more useful than either alone.
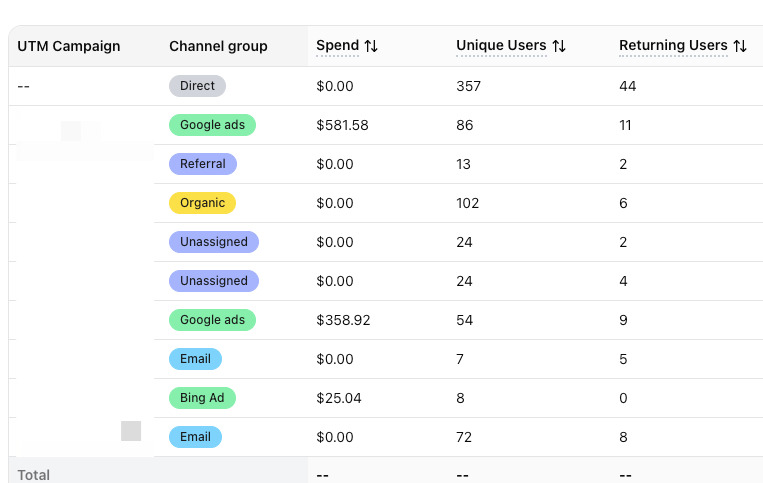
Use UTM breakdown to separate “channel” from “campaign”
Channel analysis can hide a campaign that is dragging performance down.
Break down by UTM campaign, then look for patterns:
- A few UTM campaigns absorb a disproportionate amount of spend with low purchase rate.
- A UTM campaign has strong traffic quality but weak add to cart, suggesting mismatched messaging-to-product.
- A UTM campaign has strong add to cart but weak purchases, suggesting checkout friction or low trust.
Once you isolate the culprit, you can fix the specific campaign instead of punishing the entire channel.
Use landing page analysis to catch experience problems
Landing page is where intent meets reality.
If a landing page shows:
- healthy engagement rate but weak add to cart, it often means curiosity without commitment
- strong product views but weak purchases, it often means friction after consideration
Landing page analysis is one of the fastest ways to find “experience problems” that look like “marketing problems.”
What to do when the signals disagree
This is the hard part, and it is where most teams need a framework.
Engagement is high, purchases are low
This often means your traffic is interested but the offer is not converting.
Common causes:
- price-to-value mismatch
- weak product differentiation above the fold
- unclear shipping, returns, or delivery promise
- checkout friction
Action: focus on the conversion funnel before scaling spend.
Purchase rate is down, revenue is flat
This often means average order value or product mix shifted. You did not necessarily “get worse,” you got different.
Action: check product views, add to cart, and purchases together, then compare cohorts or campaigns rather than global totals.
Returning users are up, unique users are down
This often means you are harvesting demand rather than creating it.
Action: improve top-of-funnel reach while protecting the campaigns that close demand.
Where Attribuly fits in
If you use Attribuly, Web Analysis is designed to keep cost, traffic quality, funnel behavior, and revenue in one workflow. It supports breaking down performance by channel, UTM source, UTM medium, UTM campaign, and landing page, so you can isolate what changed before you change budget.
FAQs
What is the difference between unique users and total sessions?
Why can revenue differ across tools?
Should I fix landing pages or change budget first?
About Attribuly
Attribuly helps DTC brands recover abandoned cart revenue. We identify anonymous visitors and existing subscribers your ESP (like Klaviyo) missed, enrich their profiles, and feed the signals back — so your abandonment flows fire and your retargeting audiences grow, and you recover at least 15% more revenue. Shopify featured app, Klaviyo tech partner. Trusted by 20,000+ brands. Guaranteed 4× ROI.