
Why Products Get Views but Not Purchases: A Product Analytics Framework
Use product analytics to diagnose where shoppers drop off: product views, add to cart, checkout stages, purchases, revenue, CPA, ROAS, and new customer ROAS. Turn product performance data into actions.
Related articles
TL;DR
- Product performance problems are usually funnel problems, not only traffic problems.
- Use product views, add to cart, checkout steps, and purchases to locate where shoppers drop off for each SKU.
- Combine funnel signals with outcomes like revenue, CPA, ROAS, and new customer ROAS to choose the right next action.
- Prioritize SKUs where small improvements can unlock meaningful revenue, then validate with time comparisons.
When revenue dips, teams often argue about the wrong thing.
Marketing says traffic quality is down. Product says the site is fine. Merchandising says the assortment is wrong. Finance says margins are shrinking. Meanwhile, the real answer is usually visible in one place: product analytics.
Product analytics helps you see how each product performs through the shopping journey, not just at the end. Instead of a single number like ROAS, you can trace where shoppers drop off: product views, add to cart, checkout steps, and purchases.
Why product performance is a funnel problem
A product can fail in different ways:
- It attracts attention but not intent. Views are high, add to cart is low.
- It attracts intent but not trust. Add to cart is high, checkout completion is low.
- It sells well but does not scale. Purchase rate is healthy, but product views are low.
If you only look at revenue, these problems can look identical. Product analytics separates them.
The product analytics metrics that explain what is happening
Different teams use different language, but the journey is consistent.
Discovery and consideration
Start with product views, ideally with a unique-users lens when available. Views are not demand by themselves, but they tell you whether shoppers reached the product and considered it.
Intent
Add to cart is one of the best indicators of intent. When add to cart is weak relative to product views, the product page is not closing the sale at the consideration stage.
Typical causes:
- unclear value proposition
- pricing mismatch
- confusing variants
- lack of social proof
- missing shipping and returns clarity
Checkout friction
Checkout is not one step. It is a sequence. If your product analytics includes checkout stages, you can locate friction without guessing.
Common stages include:
- checkout start
- shipping info submitted
- address info submitted
- contact info submitted
- payment info submitted
- checkout completed
When drop-off concentrates in a late stage, the issue is often shipping cost surprise, payment method limitations, or trust and fraud checks.
Outcomes and efficiency
Once you understand the funnel, evaluate outcomes:
- purchases and revenue for impact
- spend, CPA, and ROAS for efficiency
- new customer ROAS to understand whether growth is coming from new customers or existing demand
Efficiency is meaningful only after you know what the funnel is doing.
Three diagnostic patterns that change what you should do next
Views are high, add to cart is low
This is a product page and offer problem more than a traffic problem.
Before changing budget, test changes that improve intent:
- pricing and bundling
- page structure and above-the-fold clarity
- variant selection defaults
- shipping and returns messaging
If you can raise add to cart, downstream efficiency usually improves without increasing spend.
Add to cart is high, checkout completion is low
This is often friction and trust.
Look for issues like:
- unexpected shipping fees
- delivery timeline uncertainty
- coupon code distractions
- payment failures
If a single product shows abnormal checkout drop-off compared to others, it can be a fulfillment issue, not a site-wide issue.
ROAS is high, new customer ROAS is low
This pattern often means you are harvesting demand rather than creating it.
That can still be profitable, but it is a warning sign for growth. A healthy product strategy usually needs both:
- profitable closers that convert high-intent shoppers
- acquisition paths that bring in new customers
How to prioritize products using SKU analysis
Product analytics becomes powerful when you stop trying to fix everything.
Use filters and sorting to find:
- products with high product views and weak add to cart, because small improvements can unlock meaningful revenue
- products with strong add to cart and weak checkout completion, because friction fixes can pay back quickly
- products with high revenue but declining purchase rate, because the decline often starts upstream
Then validate changes with a time comparison. Comparing two date ranges can tell you whether improvements came from traffic mix changes or from product and experience changes.
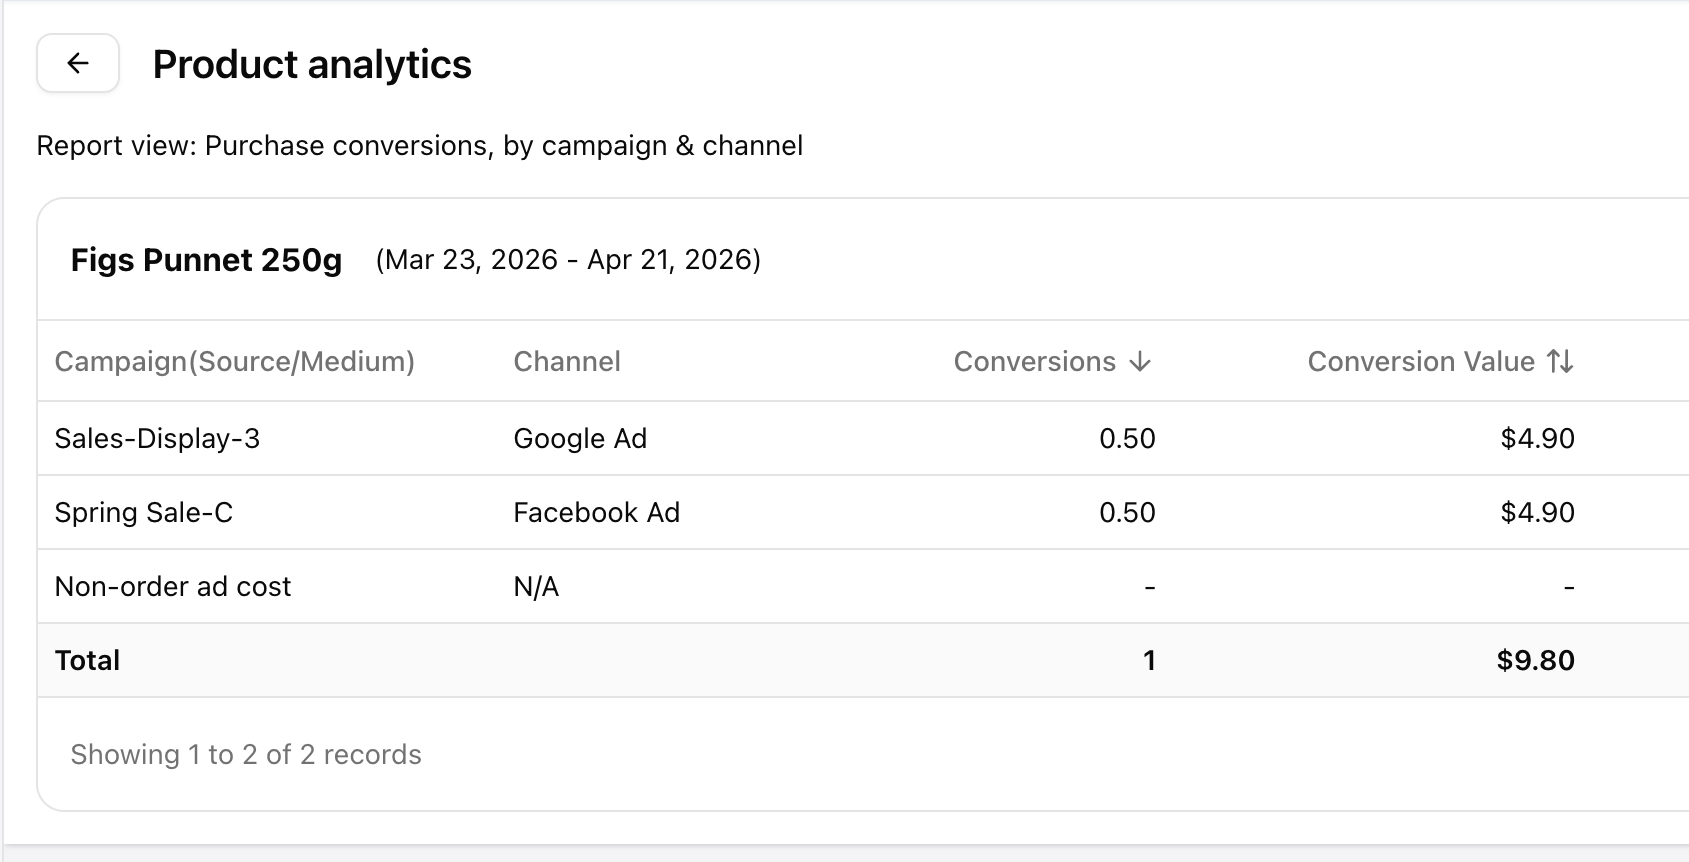
Where Attribuly fits in
Attribuly’s Product Analysis report is built to connect product performance with conversion outcomes. It supports product-level tables with customizable columns, filtering and sorting, and time comparison. You can track product views, add to cart, checkout stages, purchases, revenue, and efficiency metrics like CPA and ROAS, then review product trends over time to verify whether a change worked.
FAQs
Why should I look at both counts and unique users?
Is ROAS enough to decide which products to scale?
What is new customer ROAS used for?
About Attribuly
Attribuly helps DTC brands recover abandoned cart revenue. We identify anonymous visitors and existing subscribers your ESP (like Klaviyo) missed, enrich their profiles, and feed the signals back — so your abandonment flows fire and your retargeting audiences grow, and you recover at least 15% more revenue. Shopify featured app, Klaviyo tech partner. Trusted by 20,000+ brands. Guaranteed 4× ROI.