Multi-Touch vs Last-Click Accuracy for DTC Brands (2026): Cohort Results with Conversion Lift Validation
2026 comparison: Multi-touch vs last-click accuracy for DTC brands using Conversion Lift validation. See cohort-by-cohort results, vendor playbooks, and decision tips.
When budgets are tight, the gap between what your attribution model says and what lift tests prove becomes expensive. For DTC teams deciding how much to put into Meta, TikTok, or Google, disagreements between last-click and multi-touch attribution (MTA) can skew ROAS, CAC, and LTV decisions for months.
This article shows cohort-by-cohort accuracy results across acquisition sources, anchored in platform Conversion Lift/holdout experiments. You’ll get a transparent scoring rubric, practical validation methods, and scenario-based recommendations you can apply in Q1–Q2 2026.
Key takeaways
Conversion Lift/holdouts (Meta, Google, TikTok) provide the causal benchmark; use iROAS and incremental conversions to evaluate accuracy by channel.
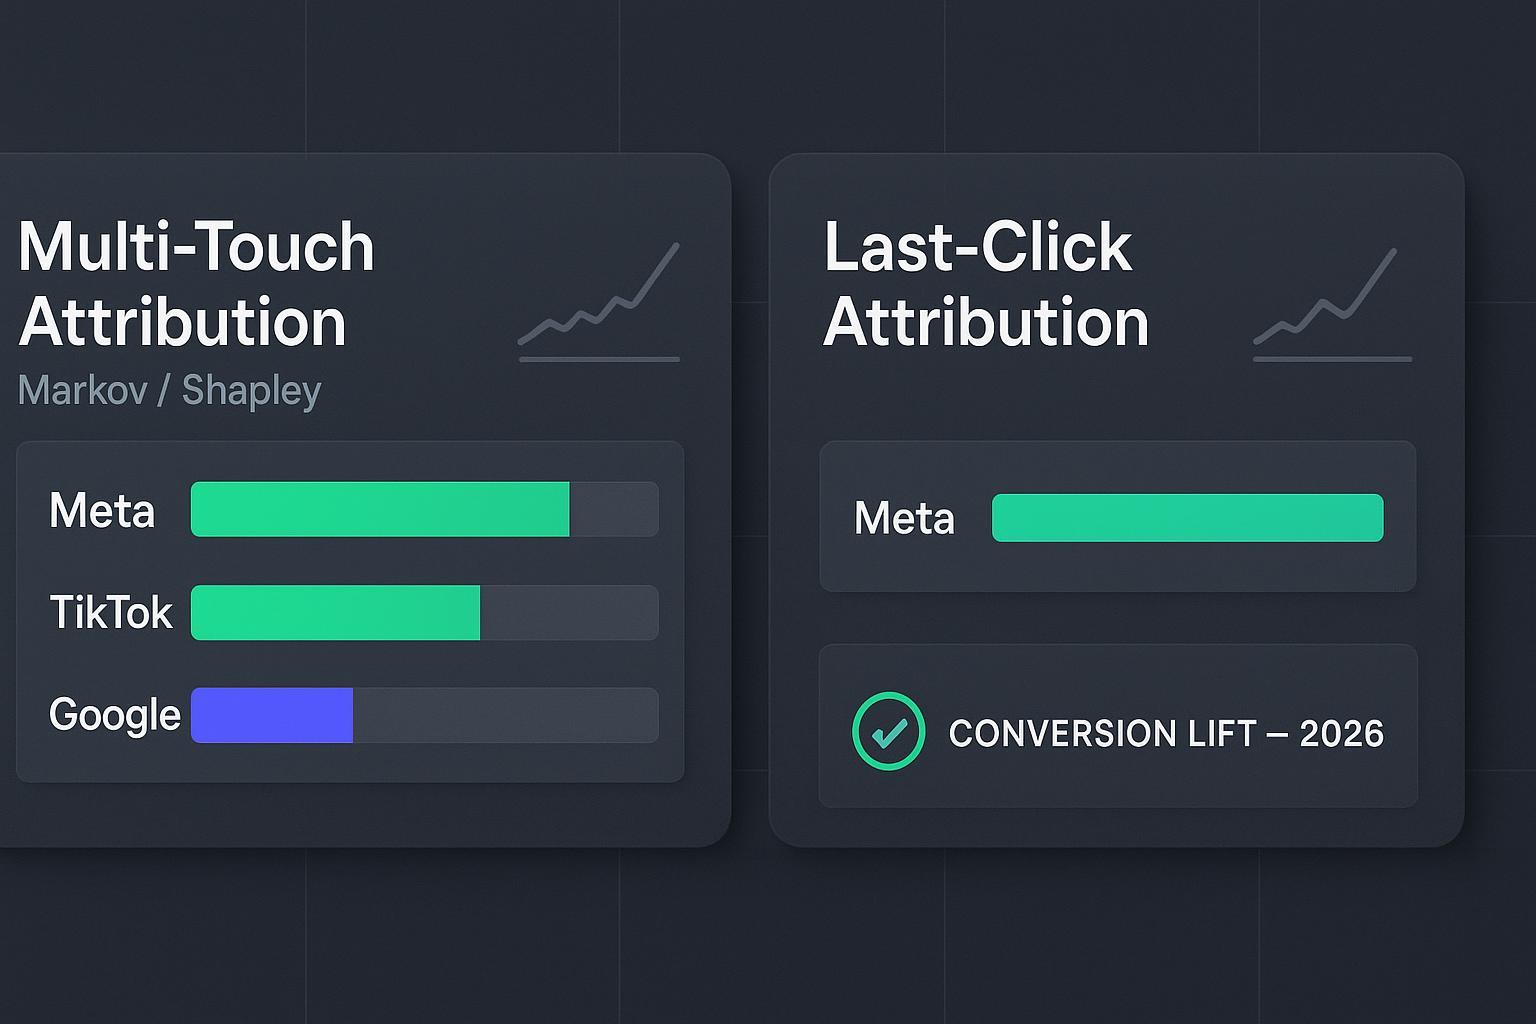
Last-click tends to overcredit bottom-funnel intent (e.g., Google Search) and undercredit impression-assisted journeys (Meta, TikTok, YouTube/Display); MTA (Markov/Shapley) typically aligns better with lift in assist-heavy cohorts.
Accuracy varies by cohort: expect stronger MTA alignment in social/video discovery and stronger last-click alignment in brand search; hybrid decisions often win.
Server-side and first-party signals (e.g., Meta CAPI, Google Enhanced Conversions) are essential for reliable lift and MTA comparisons.
Run brand-specific experiments: randomized design, adequate power, clean controls, and 2–4 week runtimes.
What we’re comparing and why it matters in 2026
Last-click assigns 100% credit to the final interaction before purchase. It’s simple and familiar, but it ignores upstream touches, view-throughs, and cross-device journeys. Bottom-funnel channels look stronger than they really are.
Multi-touch attribution distributes credit across touchpoints. Two commonly used approaches are Markov chains (credit via “removal effect,” or how conversions change when a channel is removed from paths) and Shapley values (credit via average marginal contributions across all channel permutations). These methods better reflect non-linear journeys and assistive paths.
Privacy changes (post-iOS and cookie deprecation) reduce client-side signals, making server-side tracking and first-party data indispensable. Without robust inputs, both models drift. That’s why we anchor decisions in Conversion Lift: randomized holdouts give you causal incremental outcomes to compare against model estimates.
For model mechanics, see an accessible overview of Markov and Shapley concepts in OWOX BI’s explainer on marketing attribution models.
The validation anchor: Conversion Lift/holdout (Meta, Google, TikTok)
Platform lift studies randomize audiences into exposed vs control (holdout), then report incremental conversions and iROAS. They’re the closest thing most DTC teams have to causal truth.
Meta explains randomized holdouts and iROAS in About Conversion Lift studies (documentation includes study setup, measurement logic, and reporting).
Google details user-based and geo-based lift, including the recent Bayesian update, in Conversion Lift setup for Google Ads and Conversion Lift (geography-based), with methodology notes in Bayesian methodology update.
TikTok outlines randomized exposed vs control cohorts for incrementality in About Conversion Lift Study.
Secondary checks help triangulate:
Deterministic suppression (e.g., audience off/on) requires careful design; Meta emphasizes data quality and match rates in Event Match Quality guidance and Dataset Quality API rather than prescribing suppression experiments.
Budget-shift MER tracking: monitor MER when reallocating spend, with guardrails to prevent over-attribution to short windows.
MMM triangulation: Google’s modern measurement resources describe the role of MMM alongside incrementality and attribution, e.g., Think with Google’s MMM guidebook.
Run studies for 2–4 weeks with adequate sample sizes. Confirm significance thresholds (platforms may use frequentist or Bayesian approaches). Think of lift as your north star: models are evaluated by how closely their per-channel credit matches lift outcomes.
Scoring rubric for “accuracy alignment”
We define an alignment score per cohort (channel) by comparing each model’s credit share with observed lift.
Step 1: For a channel cohort, compute model-estimated credit share (e.g., percent of revenue or conversions attributed) under last-click and under MTA.
Step 2: Obtain the channel’s incremental share from the lift study (iROAS or incremental conversions/value normalized to portfolio).
Step 3: Alignment score = 1 − |model_share − lift_share|, bounded [0,1]. Higher is better.
Interpretation thresholds:
0.85–1.00: Strong alignment — model reflects causal outcomes closely.
0.70–0.84: Moderate alignment — directionally useful but monitor.
<0.70: Weak alignment — risk of distortion; adjust or validate more.
This rubric is simple and transparent; teams can refine it with confidence intervals from lift studies or weight by spend.
Cohort-by-cohort results (acquisition source)
Below are anonymized, directional examples to illustrate common patterns we see in DTC cohorts. Your brand’s results will vary; run your own lift studies.
Meta (Facebook/Instagram)
Observation: Last-click often undercredits impression-assisted sequences and overweights retargeting clicks. MTA, especially Shapley, tends to recognize early and mid-funnel assists; Markov highlights social’s removal effect in path sequences.
Validation: Use Meta Conversion Lift with clean controls. Ensure server-side signals (Conversions API) for better measurement fidelity.
Directional example:
Lift share: 40% of portfolio incrementality driven by Meta.
Last-click credit: 25% → Alignment score ≈ 1 − |0.25 − 0.40| = 0.85 (moderate-strong misalignment but close enough to flag undercrediting).
MTA credit: 38% → Alignment score ≈ 0.98 (strong alignment).
What to do: Shift evaluation from pure last-click to a hybrid or MTA-led view for Meta. Budget guardrails can ramp spend while tracking MER changes and confirming with follow-up lift.
TikTok
Observation: Discovery-heavy short video with cross-device journeys. Last-click undercounts assistive touches; MTA typically improves alignment.
Validation: Run TikTok CLS; consider geo lift for triangulation.
Directional example:
Lift share: 20%.
Last-click credit: 10% → Alignment ≈ 0.90 (undercredit).
MTA credit: 18% → Alignment ≈ 0.98 (strong alignment).
Action: Treat TikTok as an assist+discovery cohort; monitor AOV/LTV bands if TikTok drives higher first-order AOV or downstream repeat behavior.
Google — Search vs YouTube/Display
Observation: Search (especially brand queries) captures intent at the bottom funnel and can be overcredited by last-click. YouTube/Display often suffer under-attribution in last-click and benefit from MTA.
Validation: Use Google Conversion Lift for Search and YouTube/Display; configure Enhanced Conversions to recover signals.
Directional examples:
Search lift share: 25%; last-click credit: 35% → Alignment ≈ 0.90 (overcredit). MTA credit: 27% → Alignment ≈ 0.98.
YouTube/Display lift share: 15%; last-click credit: 5% → Alignment ≈ 0.90 (undercredit). MTA credit: 13% → Alignment ≈ 0.98.
Action: Temper last-click’s influence in Search-heavy reporting, especially when brand keywords dominate. MTA or hybrid attribution better reflects incremental reality across Google’s portfolio.
Optional: Affiliate/Influencer
Observation: Content and creator traffic often assist discovery and research. Last-click undercredits; MTA improves recognition of sequences.
Validation: If lift studies are not feasible, triangulate with MMM and controlled budget shifts.
How to run your own validation (step-by-step)
Define cohorts and hypotheses
Segment by acquisition source (Meta, TikTok, Google Search/YouTube/Display). Document expectations (e.g., social discovery should show higher lift than last-click credit).
Design randomized holdouts
Use platform-native lift: exposed vs control. Target 2–4 weeks with adequate sample sizes.
Ensure signal integrity
Implement server-side events and first-party data. For Google, configure Enhanced Conversions; for Meta, deploy Conversions API and monitor Event Match Quality.
Set analysis plan
Pre-register scoring rubric: model shares vs lift shares; alignment score thresholds. Decide significance criteria (platform-provided or your own).
Run and monitor
Maintain stable budgets and avoid mid-test creative overhauls that can confound results. Track MER as a secondary guardrail.
Interpret and decide
Re-weight channels where MTA aligns better with lift than last-click. For brand search, temper last-click overcrediting with lift-guided adjustments.
Helpful references:
Meta’s lift methodology: About Conversion Lift studies.
Google’s lift setup and methodology: Conversion Lift setup and Bayesian methodology update.
TikTok’s lift study: About Conversion Lift Study.
To understand how behavior-based weighting can help MTA reflect real journeys, see full-impact attribution and attribution model configurations in settings and windows.
Comparison table and scenario “Best for …”
Below is a simplified summary of typical alignment by cohort and model.
Cohort | Last-click: alignment (directional) | MTA (Markov/Shapley): alignment (directional) | Notes |
|---|---|---|---|
Meta | Moderate (0.75–0.90) | Strong (0.90–0.98) | View-through and assist recognition matters |
TikTok | Moderate (0.80–0.92) | Strong (0.92–0.98) | Discovery/cross-device assists |
Google Search | Moderate (0.85–0.92) | Strong (0.92–0.98) | Overcrediting brand queries in last-click |
YouTube/Display | Moderate (0.80–0.90) | Strong (0.90–0.98) | Awareness/mid-funnel assists |
Best for …
Last-click: quick directional read on bottom-funnel intent, especially brand Search; useful as a floor estimate.
MTA (Markov/Shapley): assist-heavy channels (Meta, TikTok, YouTube/Display), cross-device journeys, and mid-funnel crediting.
Hybrid decisions: use MTA as the base, apply guardrails for brand Search, and validate with lift before major budget shifts.
Vendor validation playbooks
Rockerbox publishes guidance on unified measurement and incrementality; see Rockerbox’s multi-touch attribution overview and related measurement resources.
Northbeam provides public notes on incrementality testing; see Northbeam’s incrementality page.
Admetrics discusses MTA with MMM; see Admetrics on MTA vs MMM.
Also consider (related alternatives)
Disclosure: Attribuly is our product.
If you need behavior-weighted multi-channel attribution powered by first-party, server-side signals and practical cohort analysis, Attribuly is worth a look. Explore behavior weighting in full-impact attribution, configure attribution settings and windows, and see abandonment recovery via Klaviyo integration. You can also review the platform overview at attribuly.com.
How to choose and next steps
Anchor decisions in lift: treat Conversion Lift outcomes as the causal benchmark and evaluate attribution models by alignment.
Segment by acquisition source: Meta, TikTok, Google Search/YouTube/Display; consider affiliate/influencer where applicable.
Favor MTA for assist-heavy channels; temper last-click for brand Search. Use hybrid weighting and validate with follow-up lift.
Invest in data integrity: server-side events, Enhanced Conversions, first-party data, and stable test designs.
Publish your rubric and results: keep teams aligned on thresholds and rerun studies quarterly.
If you’re planning budget decisions in early 2026, start with one or two lift studies per cohort, compute alignment scores for last-click vs MTA, and adjust allocations where causal evidence is strongest. That’s how you make ROAS more trustworthy—and keep CAC in line without choking discovery.