Retargeting Incrementality: Measuring ROAS & CLV
Practical measurement playbook for performance teams: platform-native lift tests, iROAS, and CLV cohorts to reconcile attribution and scale ad spend.
If you want a single north-star metric for paid media, make it a trustworthy, unified ROAS that you can reconcile against experimental results. That means translating platform-reported returns into incremental ROAS (iROAS), then connecting iROAS to customer lifetime value (CLV) so you can scale what truly grows the business.
Key takeaways
Your hero outcome is a unified ROAS that reconciles attribution with experiment-verified iROAS.
Retargeting incrementality requires clean randomized holdouts (platform-native lift tests are the fastest path for most brands).
Report iROAS alongside platform ROAS with confidence intervals; make budget moves only on incremental revenue.
Use realized, cohort-based CLV (6/12/24 months) to detect whether retargeting improves long-term value, not just short-term orders.
Keep guardrails: adequate control size, sufficient runtime, and contamination checks, or your lift will be misleading.
Primer: ROAS, iROAS, CLV—and retargeting incrementality
ROAS is the revenue per dollar of ad spend reported by a platform or your analytics stack. Incremental ROAS (iROAS) isolates only the causal revenue created by ads through experimentation, discounting conversions that would have happened anyway. Industry guidance stresses the difference between correlation and causation for budget decisions; see the Measured resources on incrementality and iROAS framing in the Measured incrementality overview and guide (2024) and their ROI calculation FAQ. AppsFlyer also summarizes practical incrementality concepts for UA teams in its Incrementality for UA Guide (2024).
For CLV, prefer realized, cohort-based snapshots (e.g., revenue per acquired customer after 6/12/24 months) when evaluating retargeting impact. While predictive CLV has its place, realized CLV avoids model drift and shows whether retargeting changes purchase frequency and retention. GA4 supports cohort-style analysis via Retention and Explorations (see GA4 Retention overview), and you can mirror similar cohorts from order data in your warehouse.
Retargeting incrementality is simply the fraction of conversions that truly would not have happened without the retargeting exposure. Because retargeting targets warm audiences, selection bias is severe without randomization—clean holdouts and strict isolation across platforms are non‑negotiable, as emphasized by Measured’s guide and AppsFlyer’s incrementality resources.
Choose platform-native lift tests as your default design
Platform-native lift tests (Google, TikTok, and Meta) are the quickest route to randomized holdouts with robust privacy handling. Alternatives like geo holdouts or audience-level exclusions can work, but they demand heavier design effort and can be harder to power reliably.
Google Ads documents end-to-end guardrails for Conversion Lift—holdout allocation, runtime ceilings, and power expectations. See About Conversion Lift, setup for users-based holdouts and geo-based designs, the metrics interpretation guide, and their notes on study power and certainty.
TikTok’s experimentation stack provides randomized holdouts and guidance on duration and stability; start with their Conversion Lift Study overview and testing blogs like measure what matters with Conversion Lift Study.
For Meta, use Experiments in Ads Manager to check eligibility for Conversion Lift and holdout tests; reference current in-product guidance for control sizing and runtime.
When to consider alternatives:
Geo holdouts: helpful for cross‑platform spillover control and retail footprints, but you need region parity and more runtime.
Audience-level holdouts: flexible where platform tools are restricted, but leakage risk rises; randomize and enforce exclusions rigorously.
Retargeting incrementality: when and how to measure
Measure incrementality whenever retargeting’s audience composition changes (new lookback windows, frequency caps, or exclusion rules) and before major budget shifts.
Prefer platform-native lift for speed and privacy. If cross‑platform spillover is heavy, test a geo holdout. If platform tools are unavailable, do audience-level exclusions with strict randomization and leakage checks.
The platform-native lift test playbook (retargeting focus)
Below is a canonical workflow you can adapt across Meta, Google, and TikTok.
Pre-test checklist
Eligibility and coverage: include all retargeting campaigns that could expose the audience; turn on Pixels/Enhanced Conversions/Events API.
Randomization unit: users when possible; avoid cookie/device-only splits.
Control share: 10–30% is typical; higher control increases power but raises opportunity cost.
Runtime: plan for 14–28 days to match conversion lag; platform limits may apply (Google documents up to 56 days).
Sample/power: target 80–90% power; many vendors aim for >90%. DV360 guidance cites ~3,000 conversions in certain setups for significance; consult platform calculators.
Guardrails: freeze major pricing/promotions, keep budget steady, align attribution windows with test measurement windows.
Setup steps
Define the retargeting population (e.g., site visitors, cart abandoners). Ensure server-side events are enabled to capture more abandoners and improve match rates.
Create experiment with randomized control. On Google/TikTok, let the platform manage holdouts; on Meta, use Experiments.
Include all eligible retargeting campaigns and placements to reduce contamination from non‑experiment delivery.
Choose the primary outcome: purchases or revenue, with a secondary metric like conversion rate or AOV to diagnose mechanisms.
Set attribution windows to match measurement windows (e.g., 7-day click/1-day view where relevant) so lift and attribution reports can reconcile.
Monitoring and guardrails
Monitor delivery balance between groups; large imbalances can signal setup issues.
Watch for seasonality shocks or overlapping promos; if unavoidable, document and extend runtime.
Pause if control exposure is detected (leakage) or if volume collapses below minimum viable conversions.
Post-test reconciliation (from lift to iROAS)
Net lift (%) = (Test conversions – Control conversions) / Control conversions.
Incremental conversions = Net lift × Control conversions (or platform-reported incremental conversions).
Incremental revenue = Incremental conversions × AOV (or revenue delta reported by the platform).
iROAS = Incremental revenue / Test spend.
Report confidence intervals and p-values; Google’s guidance on certainty and methodology is useful for interpretation.
Reconcile iROAS with your attribution models (see flow below) to build your unified ROAS view.
Power and sample-size guidance with two quick examples
Heuristic rules you can apply before running a formal calculator:
Control share 15–25% is a good starting point; increase if volume is low.
Aim for hundreds to low thousands of conversions across groups for stable lift estimates in e‑commerce.
Plan for at least 14 days; extend to 28+ if you have longer lags or lower volumes.
Worked example A (high volume): You expect 5,000 control conversions over 14 days with a baseline CVR of 4%. You want to detect a 10% lift at 90% power. With 20% control, most platform calculators will clear this in ~2 weeks. If the test reports a 12% net lift and AOV is $80, incremental conversions ≈ 0.12 × 5,000 = 600; incremental revenue ≈ $48,000. With $60,000 spend, iROAS ≈ 0.8.
Worked example B (lower volume): Expect 500 control conversions in 28 days, detect 15% lift with 80% power using a 30% control share. If lift comes in at 18% and AOV is $120, incremental conversions ≈ 90; incremental revenue ≈ $10,800. With $8,000 spend, iROAS ≈ 1.35.
Reporting templates you can copy
Below are column specs you can paste into a CSV or BI tool.
Weekly ROAS/iROAS (CSV columns)
week_start,channel,campaign_type,spend,platform_roas,incremental_revenue,iroas,ci_lower,ci_upper,p_value,notes
  2026-01-05,Meta,Retargeting,60000,3.2,48000,0.80,0.55,1.05,0.07,Example A illustrative
  2026-01-05,TikTok,Retargeting,20000,2.1,9000,0.45,0.10,0.80,0.12,Extend test for power
CLV cohort snapshot (CSV columns)
acq_month,cohort_users,retargeting_exposed,orders_per_user,aov,rev_per_user_6m,rev_per_user_12m,rev_per_user_24m,repeat_rate_6m,repeat_rate_12m
  2025-07,4800,Yes,1.6,78,92,128,171,0.34,0.46
  2025-07,5100,No,1.3,75,81,112,152,0.28,0.40
Lift-test summary (Markdown table)
Test window | Channel | Control share | Conversions (T/C) | Net lift | Incremental rev | Spend | iROAS | CI (lower–upper) | p-value |
|---|---|---|---|---|---|---|---|---|---|
2026-01-01 → 2026-01-14 | Meta | 20% | 5,600 / 5,000 | 12% | $48,000 | $60,000 | 0.80 | 0.55–1.05 | 0.07 |
2026-01-01 → 2026-01-28 | TikTok | 30% | 590 / 500 | 18% | $10,800 | $8,000 | 1.35 | 0.90–1.80 | 0.04 |
SQL pseudo‑code (BigQuery-style) to compute incremental revenue from a lift export
-- Inputs: experiment_groups (user_id, group in ['test','control'])
  --        orders (user_id, order_ts, revenue, within_window bool)
  WITH agg AS (
    SELECT g.group,
           COUNTIF(o.within_window AND o.revenue > 0) AS buyers,
           SUM(CASE WHEN o.within_window THEN o.revenue ELSE 0 END) AS revenue
    FROM experiment_groups g
    LEFT JOIN orders o USING(user_id)
    GROUP BY g.group
  ),
  calc AS (
    SELECT *,
           SAFE_DIVIDE((SELECT buyers FROM agg WHERE group='test') - (SELECT buyers FROM agg WHERE group='control'),
                       (SELECT buyers FROM agg WHERE group='control')) AS net_lift,
           (SELECT revenue FROM agg WHERE group='test') - (SELECT revenue FROM agg WHERE group='control') AS incremental_revenue
    FROM agg LIMIT 1
  )
  SELECT net_lift, incremental_revenue;
Attribuly micro‑example: reconciling attribution with lift and segmenting CLV
Disclosure: Attribuly is our product.
In practice, you’ll want to compare your attribution‑model ROAS against experiment‑derived iROAS, then examine whether cohorts exposed to retargeting show higher realized CLV. One way to operationalize this is to use an attribution platform that supports multi‑touch models and server‑side tracking, then export events to your BI.
Attribuly supports first‑click, last‑click, linear, and position‑based models and can send enriched server‑side events (including Conversions API parameters) to ad platforms and your warehouse. You can export a multi‑touch view (e.g., via Looker Studio or API) and line it up next to your lift results from Google or TikTok. The reconciliation steps are simple: 1) pick a baseline model (say, linear) for weekly ROAS, 2) import lift‑study incremental revenue and iROAS, 3) compute a reconciliation factor by campaign type (platform ROAS vs. iROAS), and 4) apply those factors in budget allocation. For CLV, tag users who were exposed to retargeting (via server‑side events) and build 6/12/24‑month revenue‑per‑user snapshots to see whether retargeting cohorts actually buy more often or with higher AOV.
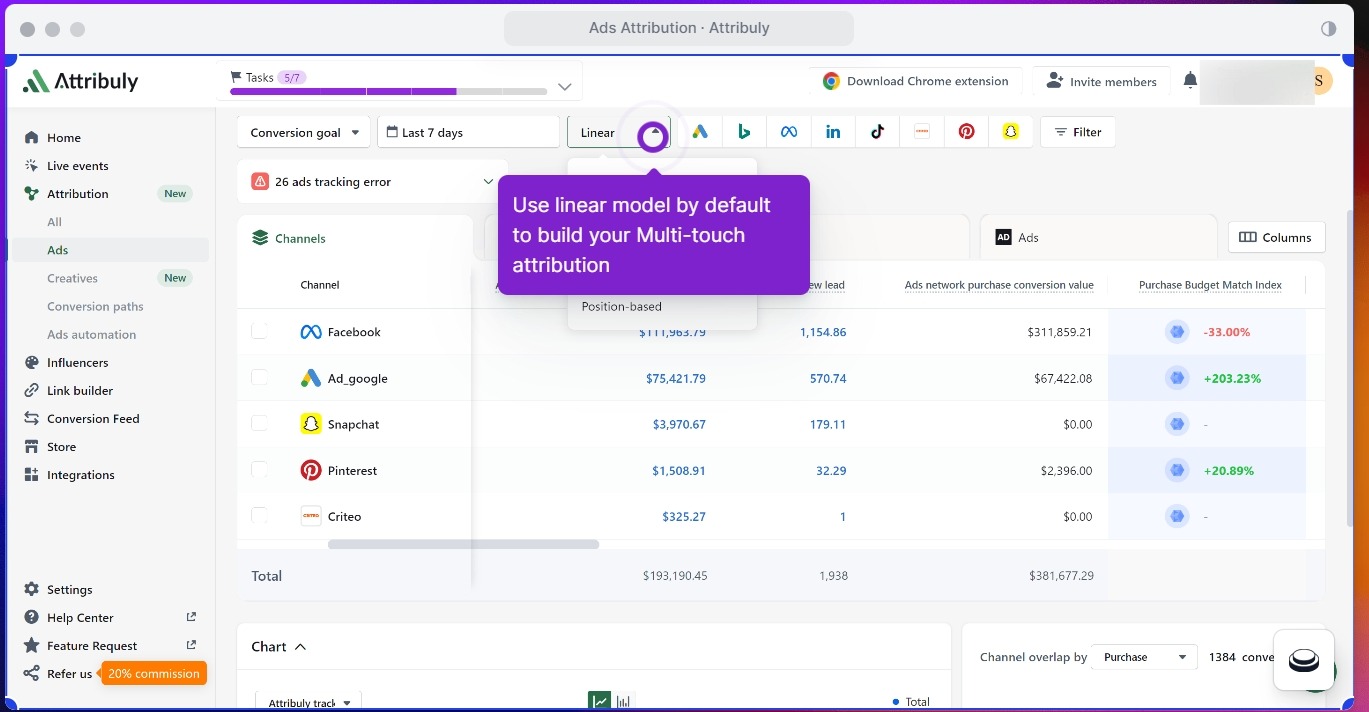
For reference on supported attribution models and server‑side events, see Attribuly’s documentation: the attribution models overview and Meta server‑side tracking guide.
Troubleshooting retargeting incrementality: common failure modes
Leakage and contamination: If control users receive ads through overlapping platforms or devices, lift will compress toward zero. Include all eligible campaigns in the test and consider geo‑based designs when cross‑platform overlap is unavoidable.
Selection bias: Audience‑level exclusions without proper randomization systematically over‑credit retargeting because the “allowed” audience is warmer. Lean on platform‑managed randomized holdouts wherever possible.
Cannibalization and halo: Retargeting can displace organic or email conversions; iROAS accounts for that by only counting incremental revenue. Segment cohorts by retargeting exposure to check for long‑run CLV deltas.
Statistical fragility: Under‑powered tests swing wildly. Extend runtime or raise control share, then report confidence intervals. The IAB/MRC guidance stresses methodological transparency—see IAB/MRC Retail Media Measurement Guidelines (2024).
What this gives you: a unified ROAS you can scale
By standardizing on platform‑native lift tests, reconciling attribution‑model ROAS to experiment‑verified iROAS, and tracking realized CLV by retargeting exposure, you get a single, defensible ROAS to steer budgets. Think of it as the speedometer you can trust when everyone else is arguing about maps.
Next steps
Stand up one platform‑native lift test this quarter on your largest retargeting pool, export the results, and compare to your attribution view. If you need a neutral, multi‑touch export to speed reconciliation, Attribuly can help.