The Ultimate Guide to Multi-Touch Attribution for Short-Form Ads
Comprehensive ultimate guide to multi-touch attribution for short-form ads—compare linear, time-decay, position-based, and Shapley with Shopify + GA4 examples. Read now.
If you run Meta Reels or TikTok and sell on Shopify, this guide will help you choose time‑decay as your primary model for multi-touch attribution for short-form ads—then validate it using ROAS stability as you scale spend.
Key takeaways
Time‑decay is the practical default for short‑form placements: it rewards recency without erasing earlier assists, aligning well with fast ecommerce cycles.
Keep ad platforms at 7‑day click / 1‑day view. GA4 can’t mirror that split exactly; align windows and triangulate with custom MTA or exported data.
Validate model choice by monitoring ROAS stability (e.g., ±15% band) as you increase spend, and cross-check against linear and position‑based results.
Implement server‑side (CAPI/Events API) with event_id deduplication to recover signals lost to privacy changes and cross-device journeys.
Use a neutral, evidence‑first workflow: pick time‑decay, then pressure‑test it with diagnostics, not gut feel.
Why short‑form ads need special handling
Short‑form ads like Reels and TikTok excel at quick discovery and nudges. People often view on mobile, then convert later—sometimes on another device. Including the 1‑day view‑through window matters: those impressions frequently assist the conversion path even if they aren’t the last click. Cross‑device handoffs are common; browser restrictions and consent settings introduce missing data. That’s why rule‑based multi-touch approaches (especially time‑decay) are handy: they’re transparent enough to operate and robust enough to reduce volatility in fast cycles.
Industry docs underscore two realities: GA4 favors data‑driven attribution (DDA) and last‑click views in many reports, while platforms like Meta and TikTok allow 7‑day click / 1‑day view windows by default. GA4 can’t explicitly set “7‑day click AND 1‑day view” the way ad platforms do; you approximate via attribution settings and align analyses outside GA4 when needed. See the practical overviews in the guide to GA4 attribution models from Search Engine Land (2024) and MarTech’s 2025 overview of GA4 model behavior for background: according to the descriptive breakdowns in the GA4 attribution guide by Search Engine Land (2024) and the GA4 models overview from MarTech (2025), GA4 exposes DDA and last‑click variants and applies windows differently across scopes.
Data foundations: Shopify + GA4 + Meta/TikTok
Windows alignment: Keep ad platforms on 7‑day click / 1‑day view. In GA4, set acquisition key events to a shorter lookback (e.g., 7 days) and be explicit that view‑through handling is not a separate toggle. The practical implication is to compare platform‑level credit with custom MTA (e.g., from GA4 BigQuery export) to enforce the desired 7/1 behavior in your own analysis. Useful explainers from the GA4 community note these limitations and tradeoffs, e.g., the GA4 attribution guide from Search Engine Land (2024) and InfoTrust’s walkthrough of GA4 attribution impacts (2024).
Server‑side tracking: Implement Meta Conversions API and TikTok Events API alongside the pixel. Deduplicate browser and server events with a shared event_id; hash identifiers (e.g., email) to improve match quality. Adobe’s Meta CAPI server extension doc (2025) and TikTok’s Events API docs (2025) detail setup and dedup logic.
Shopify event mapping: Ensure product and checkout events are sent consistently: view_item, add_to_cart, begin_checkout, purchase, etc. Google’s GA4 ecommerce developer docs describe the canonical mapping.
For GA4 and downstream destinations setup, you can consult the concise overview in GA4 integration and destinations on our support site: GA4 integration and destinations. For Meta’s server‑side path specifically, see: Meta CAPI server‑side setup.
Model deep dives: linear, time‑decay, position‑based, Shapley
Short‑form paths often look like this: TikTok view → Meta Reels click → organic search → direct purchase. Below we compare four common models for multi-touch attribution for short-form ads.
Linear (baseline sanity check): Every eligible touch gets equal credit. It’s transparent and a great team alignment baseline.
Time‑decay (recommended default): Recent touches get more weight using exponential decay. For fast ecommerce cycles, a half‑life between ~3–7 days is a practical starting point; shorter half‑life approaches last‑touch, longer spreads credit across assists. According to product and analytics docs (e.g., Adobe CJA model docs, 2025; practitioner write‑ups like Statsig’s time‑decay perspectives, 2025), exponential decay is a standard, interpretable approach.
Position‑based (U‑shaped): Emphasizes first and last touches (e.g., 40/20/40) while splitting the remainder across the middle.
Shapley (game‑theoretic): Credits each channel by its average marginal contribution across all coalitions of touches. Exact computation is exponential; Monte Carlo permutations are commonly used in practice. Google’s Ads Data Hub Shapley guidance (2024) shows scalable approximations.
Quick comparison at a glance
Model | Strengths | Risks / Caveats | When it shines |
|---|---|---|---|
Linear | Simple, transparent; great for baselining | Over‑credits weak touches; ignores recency | Sanity checks, alignment |
Time‑decay | Rewards recency; fits short cycles | Half‑life tuning matters; too short ≈ last‑touch | Fast cycles, short‑form mixes |
Position‑based | Highlights discovery and conversion | Middle touches may be under‑weighted | When discovery source is clear |
Shapley | Captures interactions; rigorous fairness | Computationally heavy; needs sampling | High‑scale teams with data engineering support |
One journey, four allocations
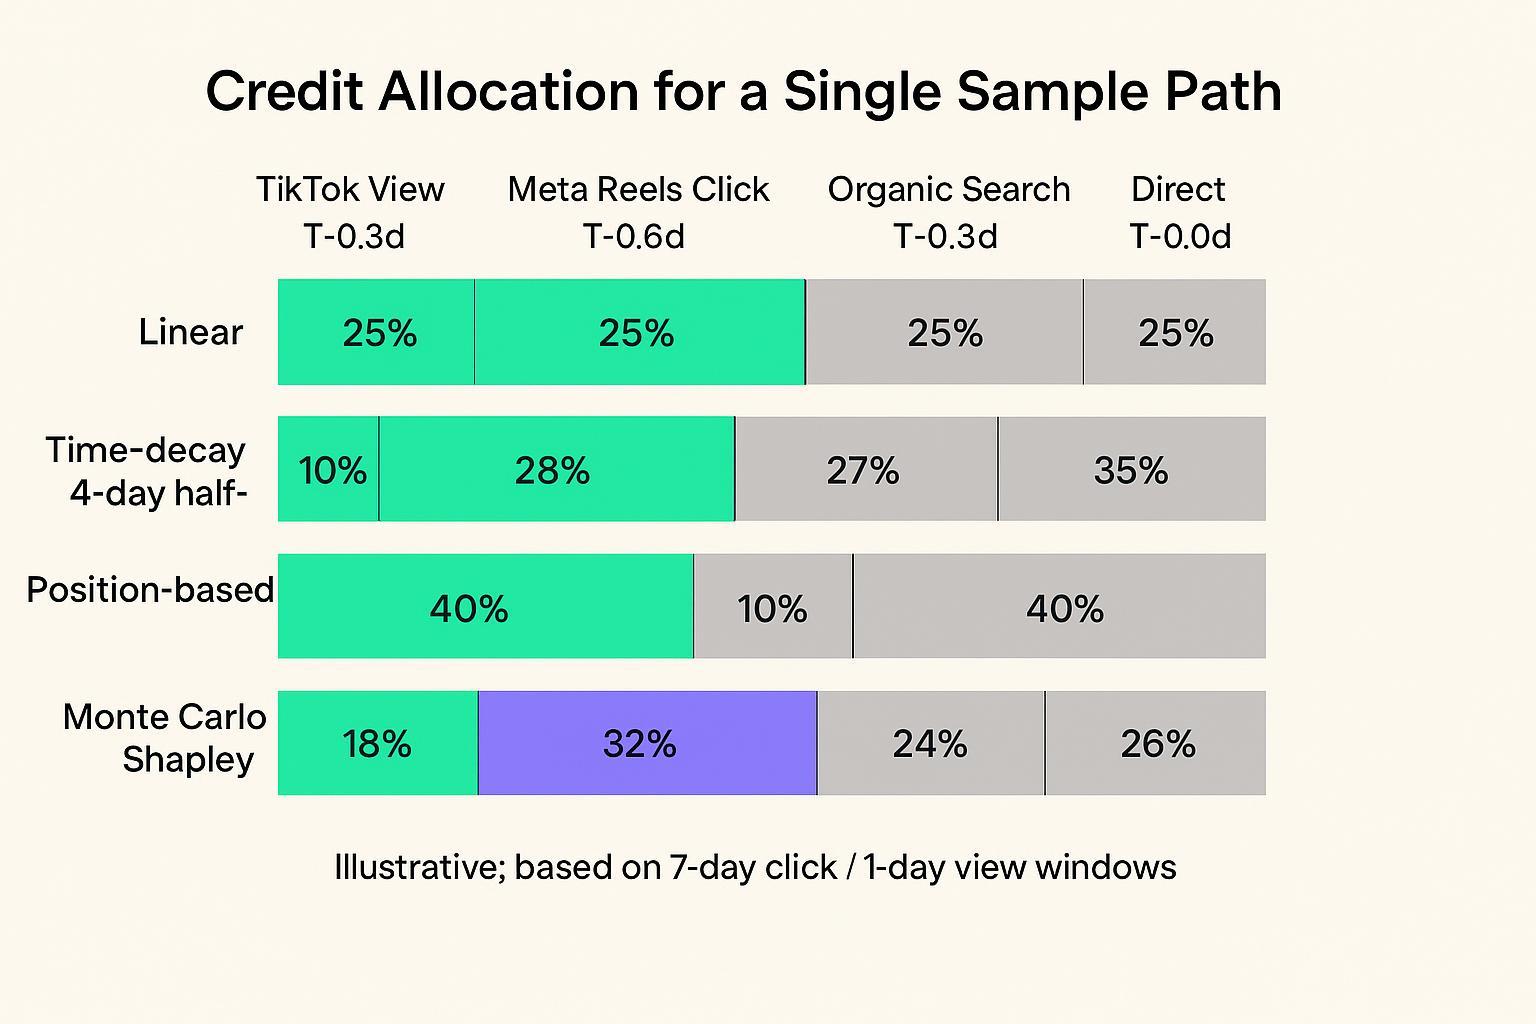
Sample path (illustrative): TikTok View (T‑0.8d) → Meta Reels Click (T‑0.6d) → Organic Search (T‑0.3d) → Direct (T‑0.0d). Using 7‑day click / 1‑day view conventions on the ad platforms, you might see:
Linear: 25% / 25% / 25% / 25%
Time‑decay (half‑life 4 days): ~10% / 28% / 27% / 35%
Position‑based (40/20/40 pattern): ~40% / 10% / 10% / 40%
Monte Carlo Shapley (sampled): ~18% / 32% / 24% / 26%
These numbers are illustrative and will vary by your path distributions and half‑life choice. The point is pattern recognition: time‑decay smooths toward recent touches without erasing discovery, leading to steadier allocations under scale.
Implementation playbook (Shopify + GA4 + Meta/TikTok)
Goal: operate with platform windows at 7‑day click / 1‑day view while aligning GA4 and custom MTA for decision‑making.
Configure platforms and GA4
Meta & TikTok: Confirm 7‑day click / 1‑day view at the account/ad group level.
GA4: In Admin → Attribution settings, set acquisition key events to a shorter lookback (e.g., 7 days). Note that GA4 does not independently toggle 1‑day view; document this limitation and plan your MTA outside GA4 when you need a strict 7/1 split. For background, see the GA4 attribution explainer by Search Engine Land (2024) and InfoTrust’s attribution impacts overview (2024).
Ship server‑side events and deduplicate
Meta: Implement Pixel + CAPI with a shared event_id to avoid double counting. Improve Event Match Quality by hashing user identifiers and enriching user_data. Adobe’s Meta CAPI server extension doc (2025) is a useful reference.
TikTok: Run both Pixel and Events API; deduplicate with shared event_id within the platform’s timing rules. TikTok’s Events API documentation (2025) clarifies logic and health checks.
QA and monitoring
Triangulate flows: Client preview (GTM) → GA4 DebugView → platform Test Events/Event Health.
Alert on API failures and match quality dips; weekly spot‑check.
Create your MTA dataset
Export GA4 events to BigQuery (or your warehouse). Assemble paths containing platform impressions/clicks and Shopify purchase events. If you can’t capture view‑through at the event level in GA4, pull platform logs and join by time windows and user keys where compliant.
Compute model views
Linear, position‑based: straightforward SQL or Python transformations.
Time‑decay: weight each touch by 2^(−x/half‑life), then normalize across the path.
Shapley: sample permutations; for each permutation, compute the marginal lift when adding a channel to the coalition; average across samples.
Visualize and compare
Create side‑by‑side model credit splits by channel, campaign, and creative. Track model agreement (e.g., overlap of top‑5 campaigns).
For a single place to connect GA4 and ad destinations in a server‑side flow, see our support collection: GA4 integration and destinations.
Validation and governance: judge models by ROAS stability
Your success metric here is ROAS stability when spend scales. The question is simple: as you grow Reels/TikTok spend, does your chosen model produce steady, sensible credit allocations and ROAS estimates, or does it swing erratically?
Use this compact diagnostic routine:
Pre/post scaling variance test
Choose a two‑ to four‑week baseline, then double spend on short‑form placements for the following two‑ to four‑week period while holding other levers as constant as practical. Expect the short‑form share of attributed revenue and campaign‑level ROAS to remain within a band (e.g., ±15%) absent major creative shifts. If time‑decay is much steadier than last‑click or overly lenient linear, that supports adoption.
Cross‑model agreement
Compare time‑decay with linear and position‑based weekly. Track overlap in top‑5 campaigns and the Pearson/Spearman correlation of campaign ROAS estimates across models. Large, unexplained divergence may indicate attribution gaming or window misalignment.
Incrementality spot‑checks
Where feasible, run small geo or time‑based holdouts to confirm directionality before big reallocations. Industry guidance on geo experiments and platform lift can help frame expectations; for instance, randomized geo tests and platform lift studies (Meta Conversion Lift) are well‑documented methods to get incremental ROAS with confidence intervals.
These steps reflect common causal‑measurement guidance and help keep your MTA honest even if it’s not a full experiment every time.
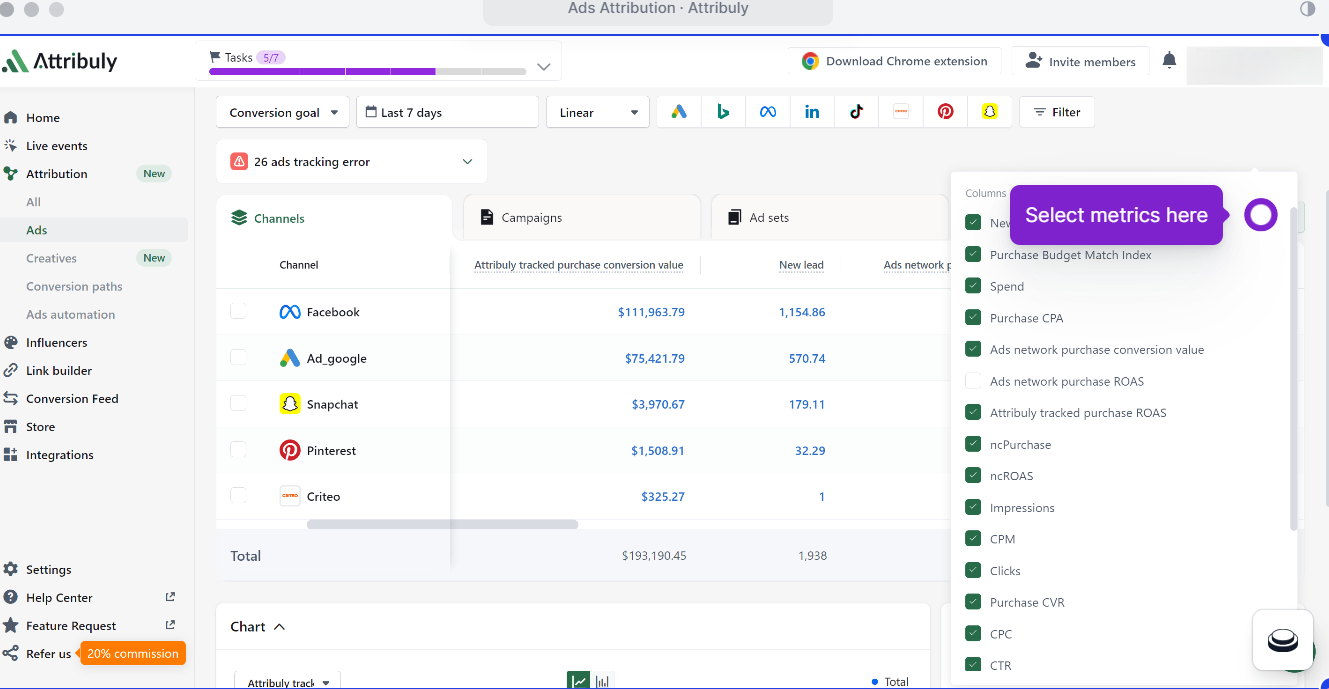
Practical example: toggling model views in a visualization tool
Disclosure: Attribuly is our product.
A neutral, reproducible way to examine short‑form assists is to visualize the same dataset under multiple models and compare campaign rankings.
In a journey visualization interface, filter for Shopify purchases and include TikTok and Meta Reels touches within 7‑day click / 1‑day view conventions.
Toggle between time‑decay (half‑life 3–7 days), linear, and position‑based. Record top campaigns and measure the overlap and ROAS variance before and after a spend increase.
Equivalent comparisons can be performed in other analytics/MTA tools or your own warehouse dashboards.
For readers who want a concrete interface to follow, Attribuly’s attribution and journey views can be used to examine multi‑touch paths and compare model outcomes: multi‑touch attribution and journey visualization.
Troubleshooting mini‑FAQ
GA4 says DDA, but I need linear/time‑decay/position‑based. What now?
Export GA4 to BigQuery or use an MTA tool. GA4 retired the old rule‑based model selector; you’ll recreate those models in your own pipeline or a third‑party platform. Overviews from publishers like MarTech (2025) explain these model changes and scopes.
I enabled server‑side—why do conversions still look off?
Check deduplication (shared event_id), identifier hashing, and Event Match Quality. Validate in GA4 DebugView plus Meta/TikTok Test Events or Event Health. Adobe’s Meta CAPI server extension overview (2025) and TikTok’s Events API documents (2025) provide the canonical steps and checks.
What half‑life should I start with for time‑decay?
Pick within 3–7 days, informed by your typical consideration window and AOV. Shorter half‑life emphasizes last touches (risking under‑credit to discovery); longer spreads credit (risking over‑credit). Track ROAS stability and adjust.
Methodology and sources
GA4 model behavior and window constraints are described in practitioner explainers and documentation. For example, see the practical overview in the GA4 attribution guide by Search Engine Land (2024) and the GA4 models overview from MarTech (2025).
Time‑decay weighting and half‑life tuning are standard across analytics stacks; Adobe’s Customer Journey Analytics attribution docs (2025) and practitioner pieces like Statsig’s time‑decay perspectives (2025) outline formulas and parameter effects.
Shapley approximations (permutation sampling) are documented by Google’s Ads Data Hub Shapley guidance (2024), with the Interpretable ML Book providing the underlying axioms.
External reading with descriptive anchors:
Read the step‑by‑step breakdown in the Your guide to GA4 attribution (2024) from Search Engine Land.
Compare model scopes in A guide to attribution models in GA4 (MarTech, 2025).
See exponential decay options in Adobe’s Attribution models for CJA (2025).
Learn how to estimate Shapley values in Google Ads Data Hub’s Shapley analysis guide (2024) and the Interpretable Machine Learning book chapter on Shapley values.
Internal resources used sparingly, for operational setup:
The bottom line
For multi-touch attribution for short-form ads, choose time‑decay as your primary model, keep platform windows at 7‑day click / 1‑day view, and validate with a ROAS stability routine as you scale. Think of time‑decay as a steadying hand—recognizing recent nudges without forgetting who opened the door. Run the diagnostic for a month, compare against linear and position‑based, and stick with what stays stable while you grow.