What Is a Good Hold Rate on Facebook Ads? 2026 Benchmarks for Shopify
What is a good Facebook ads hold rate? Learn the 2026 Shopify benchmarks, formula (ThruPlays ÷ 3s plays), testing gates, and practical fixes.
If you’re running video campaigns on Meta for a Shopify store, “hold rate” tells you whether people keep watching after the first few seconds. It’s a fast, practical signal of creative quality—but only if you calculate it consistently and pair it with business metrics like CPA and ROAS.
Key takeaways
Facebook ads hold rate in this article means: ThruPlays ÷ 3-Second Video Plays × 100. Say this formula every time you share a benchmark.
Directional 2026 bands for Shopify video ads: weak <30–35%, average ~40–50%, strong ≥60%—with variance by audience (cold vs warm) and creative length, per practitioner sources such as Motion and Triple Whale.
Create a custom column in Ads Manager to track hold rate; then gate creative tests with both attention metrics (hook/hold) and business outcomes (CPA/ROAS).
If hold rate is low, fix the first 10 seconds: sharpen the value prop, add proof early, and quicken pacing. Always re-check attribution windows before declaring winners.
Definition: what “Facebook ads hold rate” means (and the exact formula)
In ecommerce creative analysis, the most common definition is:
Hold rate = ThruPlays ÷ 3-Second Video Plays × 100.
Think of hook rate as “did they stop scrolling?” and hold rate as “did they keep watching?” Practitioner guides align on this framing: Motion provides the explicit formula and cites average 40–50% with ≥60% considered strong in its overview of creative performance metrics, while Triple Whale explains 3s-to-15s retention as a practical way to judge creative engagement in its Facebook ad analytics guide. See: the discussion of hold-rate formulas in the Motion guide to key creative performance metrics and the framing of 3-second to 15-second retention in Triple Whale’s Facebook Ad Analytics.
Quick example: If your ad has 4,500 three‑second video plays and 2,000 ThruPlays, your hold rate is 2,000 ÷ 4,500 × 100 = 44.4%.
A note on variants: Some teams use 15‑second plays ÷ impressions. That variant usually produces lower percentages, especially on cold traffic. Whenever you compare or publish a number, state your formula. For additional practitioner context on hook and hold measurement setups, see Billo’s explainer on hook‑to‑hold metrics.
2026 Shopify benchmarks for Facebook ads hold rate
The ranges below assume the formula above (ThruPlays ÷ 3s video plays × 100) and summarize patterns cited by multiple 2024–2026 practitioner sources. Use them as directional guardrails, not hard rules.
Formula used | Weak | Average | Strong | Caveats |
|---|---|---|---|---|
ThruPlays ÷ 3-Second Video Plays × 100 | <30–35% | ~40–50% | ≥60% | Cold vs warm audiences, creative length, and definition variants all shift the bands. Practitioner sources such as Motion and Triple Whale report similar ranges. |
Cold prospecting often trends lower than warm or retargeting audiences. Very short ads can inflate hold relative to longer storytelling spots. If a team uses 15s ÷ impressions, expect lower “healthy” bands and don’t cross-compare with the 3s‑to‑15s definition. For an alternate view that quotes lower healthy ranges for cold traffic under different formulas, compare the perspective in AdLibrary’s note on hold rate for cold audiences.
How to calculate hold rate in Meta Ads Manager
Because “hold rate” isn’t a native column, create a custom metric so every ad review uses the same math.
In Ads Manager, open Columns → Customize Columns → Create custom metric.
Name: Hold Rate. Formula: ThruPlays / 3-Second Video Plays. Format: Percentage.
Save the metric and add it to your preset so all teammates see the same view. For clarity, add a nearby column for Hook Rate (3‑Second Video Plays / Impressions).
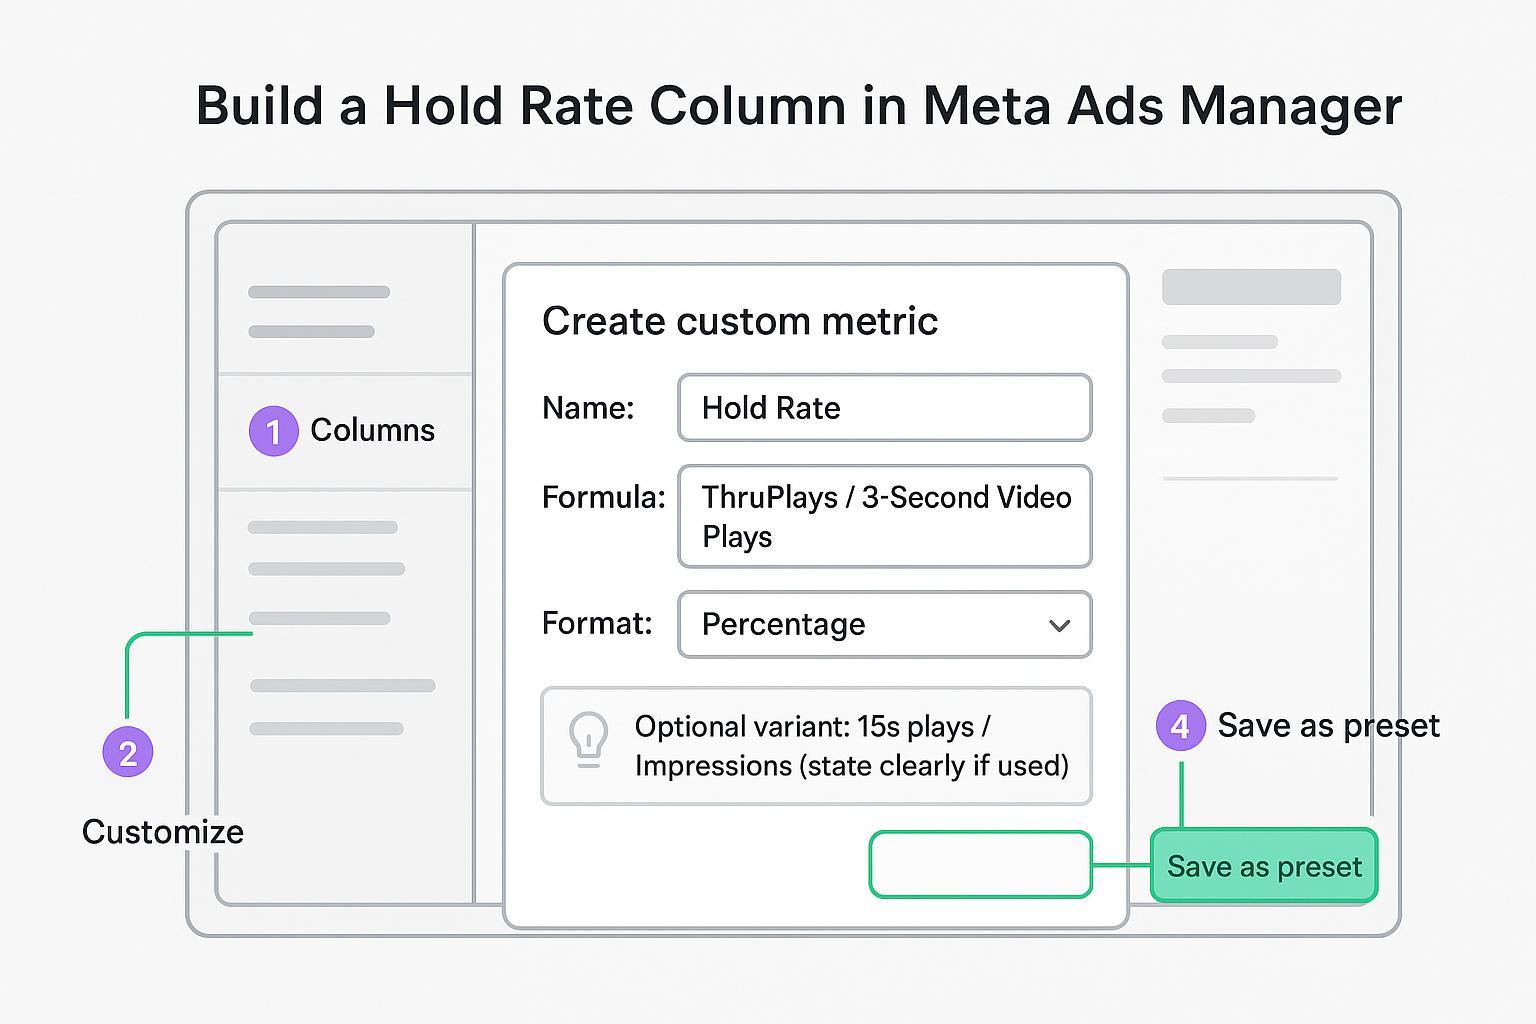
Tip: If you test the alternate variant (15s plays / Impressions), label it distinctly (e.g., “Hold (15s/Imp)”) so benchmarks aren’t mixed. A practical walkthrough of custom-metric setup appears in GetKoro’s guide to creating hook and hold metrics.
Testing and decision framework: pass, win, survive
Attention metrics qualify creatives; business metrics decide if they scale. Here’s a simple, auditable framework for Shopify brands:
Pass gate (attention): Hold rate ≥ your target band (e.g., ≥45% soft pass, ≥60% strong pass) and hook rate ≥ your account median.
Business gate: CPA ≤ your target and/or ROAS ≥ 3× (adjust by margin and LTV). Ads that pass attention but miss business outcomes shouldn’t advance.
Win: Among ads that pass both gates and meet a spend or impression floor, select the best CPA/ROAS as the winner for scale.
Survive: Keep running only if the ad continues to clear thresholds after 48–72 hours or N impressions. Document and automate kill rules.
This approach borrows common creative‑testing practices and benchmark context discussed in practitioner sources such as the Motion guide above and Triple Whale’s 2026 Facebook ads benchmarks roundup.
A practical creative playbook to raise hold rate
Use hold rate to spot where attention drops, then apply targeted edits. Here’s a compact set of levers most Shopify teams can act on quickly:
Open with clarity in 0–3s: Product in frame, problem surfaced, or result previewed. Re‑state the core value by 5–7s.
Tighten pacing: Faster cuts in the first 8–12s; remove dead air and long establishing shots.
Add proof early: Ratings, UGC quotes, or mini before/after moments before the 10‑second mark.
Pattern interrupts: Visual or angle shifts at ~3–5s and again around 8–10s to reset attention.
Mobile‑first readability: Bold text overlays and captions; legible typography and safe margins.
Angle segmentation: Test problem/solution, testimonial, product demo, and transformation narratives; measure which angles sustain attention.
If hold is still middling after these changes, examine runtime: short and medium edits behave differently on hold—don’t assume one length fits all.
Troubleshooting: linking attention to outcomes
High hook, low hold: The opener works, but the story sags. Trim the middle, front‑load a benefit, and insert proof earlier.
Low hook and low hold: The first three seconds aren’t stopping the scroll. Replace the opener with a bolder claim or striking visual; re‑shoot the intro if needed.
High hold, poor conversion: Creative is engaging, but the offer or landing experience is misaligned. Revisit pricing, bundle, page speed, and also verify attribution windows before drawing conclusions.
Measurement hygiene for Shopify (keep comparisons fair)
Hold‑rate insights only matter if purchase reporting is trustworthy and consistent:
Align attribution windows across platforms when comparing creatives (e.g., evaluate purchases on a consistent 7‑day click / 1‑day view basis) to avoid mismatched credit. For a practical overview of reconciling Meta vs. Shopify vs. other channels, see the explanation of cross‑platform window mismatches here: Shopify attribution mismatches across Meta and TikTok.
Use Conversions API alongside pixel events with deduplication (shared event_id) and monitor Event Match Quality to preserve view‑through accuracy. For setup concepts and checklists, review this help collection on attribution and server‑side tracking: Server‑side attribution setup and concepts.
Validate purchase tracking with test orders (including Shop Pay) to confirm events flow and deduplicate correctly. For a practical audit of UTMs and event capture, see: Ad tracking in Attribuly (overview).
Neutral example (non‑promotional): After adding a Hold Rate column, a Shopify marketer shortlists two ads at ~58% and ~63% hold. Platform‑reported ROAS disagrees with Shopify orders. To keep the comparison fair, they reconcile results in a single view that supports Conversions API, deduplication, and unified windows (for example, Attribuly), then advance the ad that also meets their CPA/ROAS thresholds.
Advanced note: when to prioritize hold over conversion
Early in concept testing, it’s reasonable to optimize for attention first—especially when budgets are tight and you need fast readouts. As soon as two or more concepts clear your hold‑rate target and hook‑rate median, switch emphasis to CPA/ROAS and customer quality (e.g., cohort LTV). In some verticals, strong hold correlates with better downstream engagement, but it’s not a guarantee—measure it in your data.
Short recap
Define Facebook ads hold rate explicitly (ThruPlays ÷ 3s plays × 100) and don’t mix formula variants.
Use 2026 directional bands for Shopify: weak <30–35%, average ~40–50%, strong ≥60%.
Gate creative tests with both attention and business metrics; fix attribution windows before picking winners.
Improve hold by sharpening the first 10 seconds, adding proof early, and tightening pacing.
If you need a single place to reconcile creative insights with consistent attribution windows for Shopify, consider a solution that supports CAPI and unified reporting (e.g., Attribuly) so your hold‑rate winners are also business winners.