Attribution Models vs ROAS for Apparel Brands (2026) Comparison
Compare last-click, first-click, linear, time-decay & data-driven attribution models for apparel. See how cohort splits reshape ROAS in 2026 with real examples.
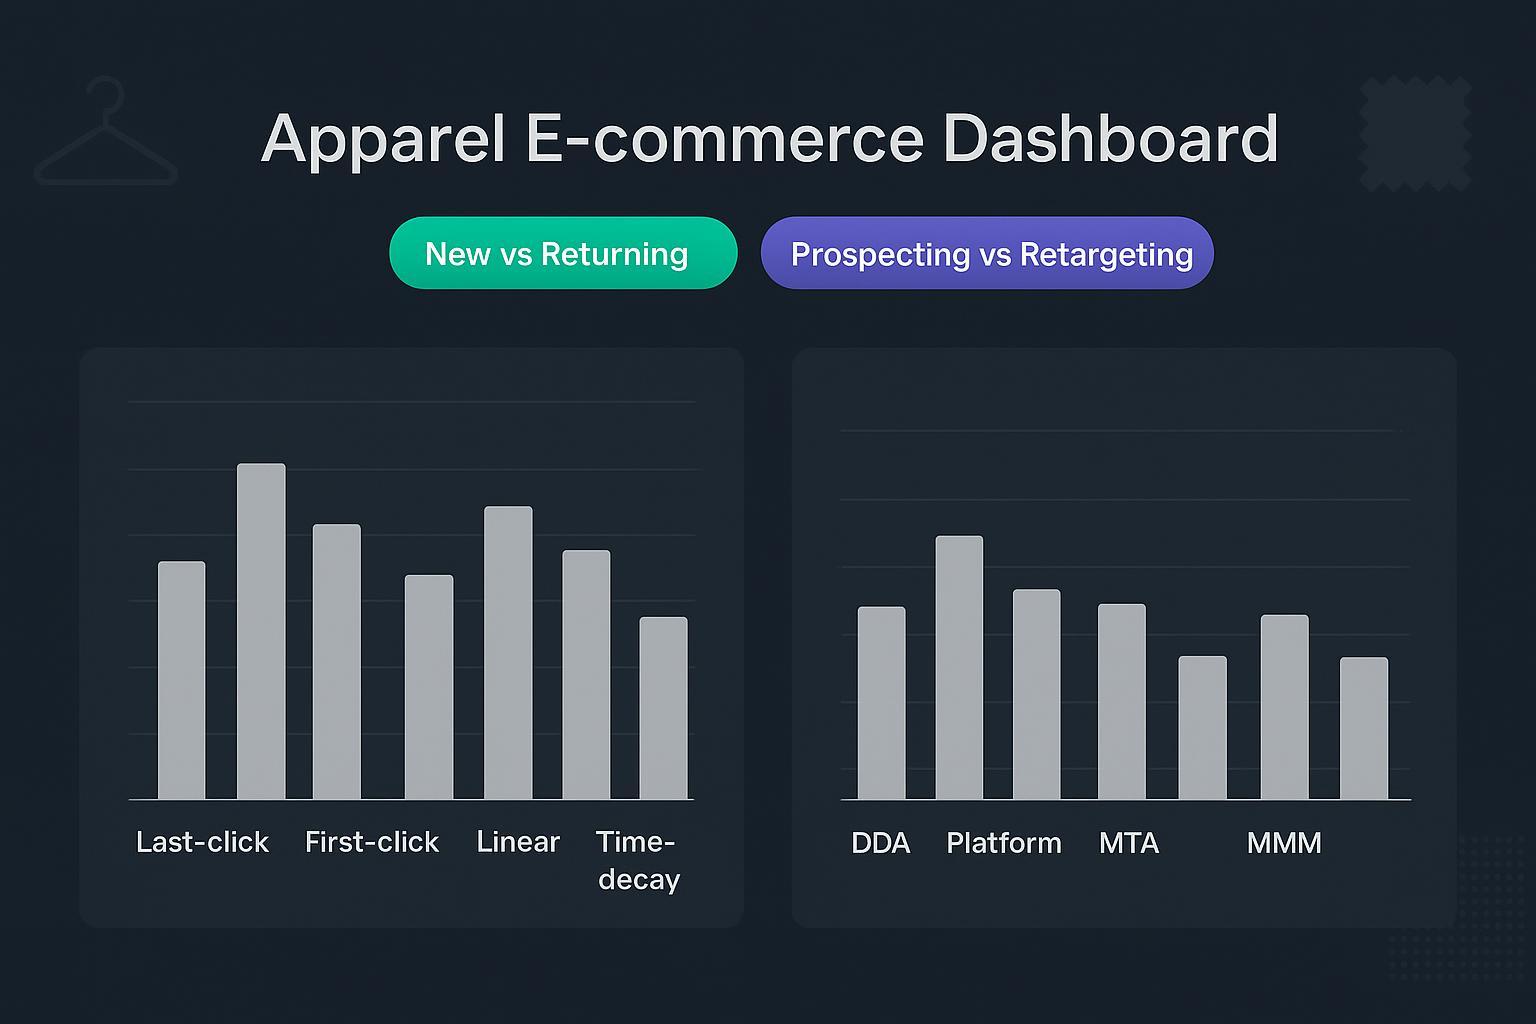
Apparel ROAS is notoriously slippery. High online return rates, margin swings between basics and seasonal lines, and short‑video discovery all conspire to make “which touchpoint gets credit?” the deciding factor in your reported performance. The fastest way to surface bias is to anchor comparisons by cohort: new vs returning buyers and prospecting vs retargeting. In this article, we compare nine attribution models and measurement approaches side‑by‑side, using gross revenue as the ROAS basis (as many platforms do), and note where apparel realities can inflate or suppress the numbers.
A quick caveat for context: industry sources estimate online returns near the 19–21% range in recent data, which can materially distort gross ROAS, especially in retargeting cohorts. The National Retail Federation reported online returns at 19.3% for 2025 in its returns landscape, underscoring how basis choice changes interpretation; see the NRF’s overview in the 2025 retail returns landscape. When in doubt, sanity‑check cohort ROAS against an incrementality baseline.
Key takeaways
Cohort splits reveal model bias fast: last‑click inflates returning/retargeting; first‑click inflates new/prospecting; data‑driven and algorithmic methods often re‑credit creator/UGC discovery.
Using gross revenue as ROAS basis makes apparel look better than reality in return‑heavy segments; consider net or contribution margin for decisioning sanity checks.
Platform windows and modeled conversions change results. TikTok’s engaged view‑through attribution (EVTA) and view windows can lift prospecting ROAS; Google’s DDA redistributes credit across multi‑touch paths; Meta’s reporting changes affect window availability.
MMM/MER is a reliable executive baseline that tempers model swings with an incrementality view; use it to calibrate budgets while MTA/DDA handle day‑to‑day optimization.
Side‑by‑side: model family vs cohort ROAS tendencies
Model/Approach | Discovery Weight | Retargeting Weight | New Buyers ROAS | Returning Buyers ROAS | Notes |
|---|---|---|---|---|---|
Last‑click | Low | High | Suppressed | Inflated | Favors branded search/retargeting; undercounts UGC discovery |
First‑click | High | Low | Inflated | Suppressed | Favors prospecting and creators; ignores final nudges |
Linear | Medium | Medium | Balanced | Balanced | Reduces extremes; may dilute standout drivers |
Time‑decay | Medium‑Low | Medium‑High | Moderately suppressed | Moderately inflated | Emphasizes late‑stage touches |
Position‑based (U/W) | High (first) + High (last) | Medium | Higher vs last‑click | Higher vs first‑click | Mid‑funnel undervalued |
Google DDA | Data‑weighted | Data‑weighted | Often higher vs last‑click | Often fair vs last‑click | Depends on data/config; cross‑channel imports matter |
Platform‑reported (Meta/TikTok) | Varies with view/EVTA | Strong in short windows | Can inflate with long view windows | Strong | Confirm window choices; avoid overly long VTA/EVTA |
Algorithmic MTA (Shapley/Markov) | High (if marginal lift proven) | Calibrated | More accurate marginal lift | Clearer on saturation | Infra heavy; identity resolution needed |
MMM/MER | Aggregate | Aggregate | Strategic baseline | Strategic baseline | Privacy‑resilient incrementality view |
Model capsules: cohort‑anchored implications for apparel
Ordering follows model families (single‑touch, rule‑based multi‑touch, platform/data‑driven, algorithmic, top‑down).
1) Last‑click
How credit works: 100% to the final touchpoint before conversion.
Cohort impact (apparel): Overweights retargeting and branded search, inflating ROAS for returning buyers and retargeting cohorts; underweights prospecting that kicks off discovery for new buyers.
Best for: Quick transactional reads; branded search and cart‑abandonment nudges.
Constraints: Cross‑device blind spots; shorter post‑privacy windows reduce linkages for longer journeys; discovery undervalued. High returns make gross ROAS look stronger than profit reality in retargeting cohorts.
2) First‑click
How credit works: 100% to the initial touchpoint that started the journey.
Cohort impact (apparel): Overweights prospecting/awareness, raising ROAS for new‑buyer and prospecting cohorts; undervalues nurture and retargeting that often resolve fit or deal‑seeking behavior.
Best for: Testing creators/UGC as discovery engines; top‑funnel budget allocation.
Constraints: Ignores mid/late‑funnel contributions; can misdirect budgets away from retargeting sequences that close revenue.
3) Linear (even)
How credit works: Equal credit across all touches in the path.
Cohort impact (apparel): More balanced across prospecting and retargeting for both new and returning cohorts; standout drivers (creators, key sequences) can be diluted.
Best for: Reducing single‑touch extremes; fair starting point when journeys vary widely.
Constraints: Credits low‑value touches equally; lowers actionability for optimization.
4) Time‑decay
How credit works: Increasing credit to touches closer to conversion; earlier touches receive less.
Cohort impact (apparel): Emphasizes late‑stage retargeting and offer nudges; still undervalues initial discovery that matters for new cohorts.
Best for: Brands with shorter decision cycles and strong retargeting playbooks.
Constraints: Half‑life and lookback choices materially change cohort skew; discovery undervaluation persists.
5) Position‑based (U/W‑shaped)
How credit works: Higher weights to first and last touches; middle touches receive lower credit.
Cohort impact (apparel): Recognizes both discovery and final nudges; mid‑funnel items (fit guides, influencer reminders) are discounted. New‑buyer cohorts appear stronger than in strictly last‑click views; returning cohorts still benefit from last‑touch weight.
Best for: Brands balancing awareness and closure; storytelling funnels with decisive final steps.
Constraints: Predefined weights may miss true marginal effects; mid‑funnel undervalued.
6) Data‑driven (Google Ads/GA4 DDA)
How credit works: Google’s AI assigns credit based on observed conversion paths rather than fixed rules; DDA is the default in Google Ads and GA4. See Google’s attribution documentation on GA4 Attribution settings.
Cohort impact (apparel): Better captures multi‑touch journeys across Search/YouTube and linked sources, often re‑crediting creator/video discovery versus last‑click; cross‑channel blind spots remain if non‑Google interactions aren’t imported or linked.
Best for: Brands with sufficient volume and clean linking (Ads, GA4, Enhanced Conversions) seeking more realistic path credit.
Constraints: Thresholds/volume requirements; ecosystem bias if cross‑channel imports are incomplete.
7) Platform‑reported (Meta, TikTok)
How credit works: Platform‑modeled conversions and configurable attribution windows, including view‑through variants.
TikTok specifics (2026): Ad group‑level settings offer click windows (1–28 days), view windows (Off/1/7), and EVTA (Off/1/7/28). See TikTok’s attribution settings overview and EVTA docs about engaged view‑through attribution.
Meta notes (2026): Meta announced changes to Ads Insights API metric/window availability, affecting certain breakdowns; verify your account’s current Ads Manager defaults. Reference Meta’s developer update in Ads Insights API metric availability updates.
Cohort impact (apparel): View/EVTA can materially increase prospecting ROAS on creator/UGC exposure; shorter windows make retargeting look stronger. Window choice drives cohort skew.
Best for: Rapid creative iteration within each platform; understanding modeled reach effects.
Constraints: Window inflation risks; cross‑platform reconciliation needed; ensure server‑side feeds (e.g., Meta CAPI) for better signal.
8) Algorithmic MTA (Shapley/Markov)
How credit works: Shapley values compute marginal contribution across all path permutations; Markov chains identify removal effects by modeling state transitions across sequences. For a practical overview, see the ACM’s guide to last‑touch and multi‑touch attribution.
Cohort impact (apparel): More accurate marginal contributions can shift budget toward effective discovery channels (creator/UGC) and clarify retargeting saturation for returning cohorts.
Best for: Teams ready to invest in identity resolution and path modeling; brands needing cross‑channel fairness.
Constraints: Computational and implementation complexity; model governance; data quality demands.
9) MMM/MER baseline
How credit works: Top‑down, privacy‑resilient modeling estimates incremental impact of spend across channels, accounting for lag, saturation, and seasonality. Google’s open‑source Meridian is a useful reference; see About the Meridian project.
Cohort impact (apparel): MMM contextualizes cohort ROAS swings (promotions, seasonal lines, influencer pushes) and reconciles platform‑reported ROAS via incrementality.
Best for: Executive budgeting and pacing; calibrating channel‑level ROAS and MER.
Constraints: Slower cycles; aggregate resolution; requires clean spend and outcome data; not for day‑to‑day creatives.
Attribution windows and server‑side signals (2026 quick notes)
Google Ads/GA4: Enhanced Conversions improve attribution and bidding by matching hashed first‑party data with conversions. Strongly recommended alongside DDA for ecommerce purchases; see Google’s Enhanced Conversions.
Meta: Conversions API (CAPI) Gateway remains a recommended server‑side pathway to bolster signals and reduce pixel fragility; review Meta’s CAPI Gateway docs.
TikTok: Configure attribution windows and consider EVTA conservatively for upper‑funnel creative. TikTok’s help center outlines options in the attribution overview.
ROAS basis for apparel: gross vs net vs contribution margin
Gross revenue (used here): Mirrors typical platform reporting and is simple, but apparel’s elevated return rates can inflate ROAS—particularly in retargeting cohorts where decisive purchases also churn back as returns.
Net revenue: Deducts returns and cancellations; more realistic profit lens for cross‑cohort comparisons. Useful as a secondary view to validate budget shifts suggested by model changes.
Contribution margin: Deducts COGS, shipping, discounts. Essential for lines with tight margins or heavy promo. When attribution swings shift spend toward high‑return categories, contribution margin keeps decisions tethered to profitability.
How to choose: a decision playbook for growth teams
If the goal is prospecting discovery for new buyers: Test first‑click or position‑based to spotlight initiators. Cross‑check with Google DDA to confirm multi‑touch lift and avoid over‑crediting single exposures.
If the goal is accurate closure measurement for returning buyers: Time‑decay or last‑click capture late‑stage nudges. Validate with net or contribution margin views to catch inflated gross ROAS from returns.
If the goal is cross‑channel fairness: Algorithmic MTA (Shapley/Markov) or Google DDA provide more balanced credit. Ensure server‑side signals and proper imports (Search, YouTube, paid social) before drawing conclusions.
If the goal is executive budget calibration: Use MMM/MER as the anchor. Let MMM temper platform‑reported ROAS, then use MTA/DDA for weekly optimization.
Also consider: neutral tool example
Disclosure: Attribuly is our product.
For teams that want to toggle models by cohort without rebuilding dashboards, a tool that supports multi‑model views and cohort splits helps operationalize the comparisons above. As an example, Attribuly offers a custom attribution model option and ROAS views that can be segmented by buyer type, allowing you to compare last‑click vs first‑click vs multi‑touch models against new vs returning and prospecting vs retargeting cohorts. Keep usage neutral and evidence‑driven—use MMM to sanity‑check whichever model appears “best.”
Final summary
Different attribution models can move apparel ROAS by double digits purely through crediting logic, especially when you split results by new vs returning and prospecting vs retargeting. Single‑touch models polarize cohorts; rule‑based multi‑touch tones down extremes; platform/data‑driven and algorithmic methods often re‑credit creator/UGC discovery and clarify retargeting saturation. Given apparel’s return dynamics, keep a net or contribution margin lens nearby, and use MMM/MER to anchor budgets while MTA/DDA refine tactics. When windows or modeled conversions are involved, document settings, choose conservative view‑through options on upper‑funnel creative, and validate cohort swings with server‑side signals. Then, iterate confidently—your ROAS will be closer to reality, and your budget will follow suit.