 Attribuly
New Customer CPA Benchmark
Is your new customer CPAactually good?
Hi there,
Here's a simple question: Is a $35 New Customer CPA good?
It depends. A $35 NC-CPA can look very different for a store with a $30 Average Order Value (AOV) versus one with a $300 AOV.
A single NC-CPA number cannot tell you whether your performance is good. You need context.
That's why we built the New Customer CPA Benchmark, based on aggregated data from 400+ brands. It gives your NC-CPA context: compare with similar-AOV stores, see where you stand, and find which ad channels are driving the biggest gaps.
See how your NC-CPA compares
Attribuly automatically compares your NC-CPA with stores in a similar AOV range. You'll see your NC-CPA alongside the cohort distribution, including the top 10% (P10), the median (P50), and other percentile ranges—so you can immediately tell whether your acquisition cost is lower or higher than comparable stores.
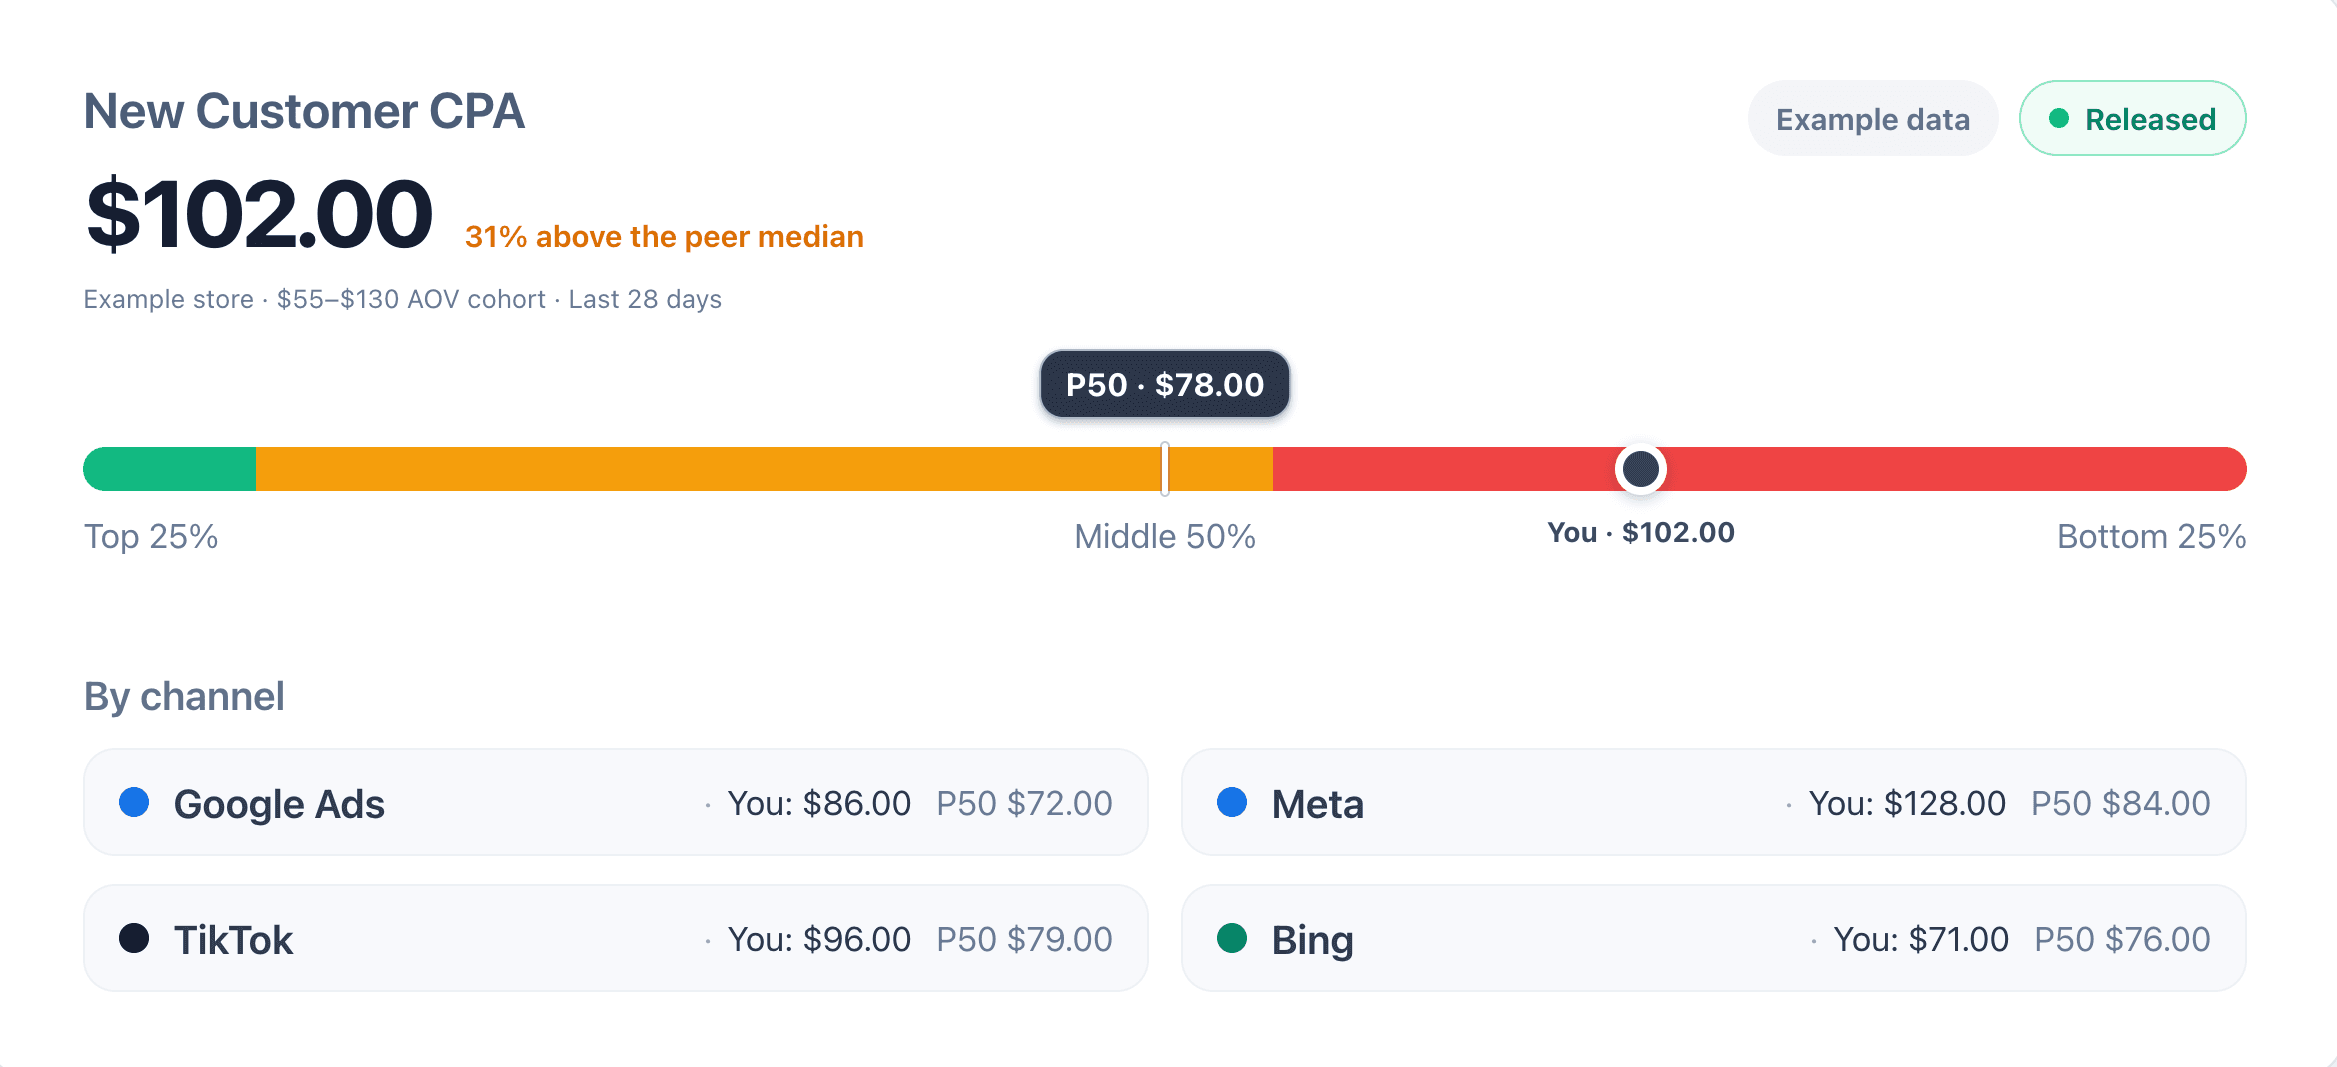
Log in to Attribuly and connect your ad account to view your NC-CPA and its comparison.
See where my store stands →Why compare by AOV?
Because acquisition costs need context.
A $35 NC-CPA can be difficult to sustain for a store with a $30 AOV, but with a $300 AOV, that same acquisition cost can look much more efficient. Comparing stores with similar order economics gives you a much more meaningful benchmark.
Find where the gap comes from
Knowing that your NC-CPA is high is useful. Knowing why is even more useful.
Connect your ad accounts to break down your NC-CPA across Meta, Google Ads, TikTok, Bing, and more. For each channel, you can see your NC-CPA and compare it with the same channel for similar-AOV stores.
Instead of only knowing “My NC-CPA is $42,” you can see something much more actionable: “My NC-CPA is above the median for similar stores—but Meta is driving the biggest gap.” Now you know where to look next: improve your Meta NC-CPA, close the gap, and get more from every dollar you spend.
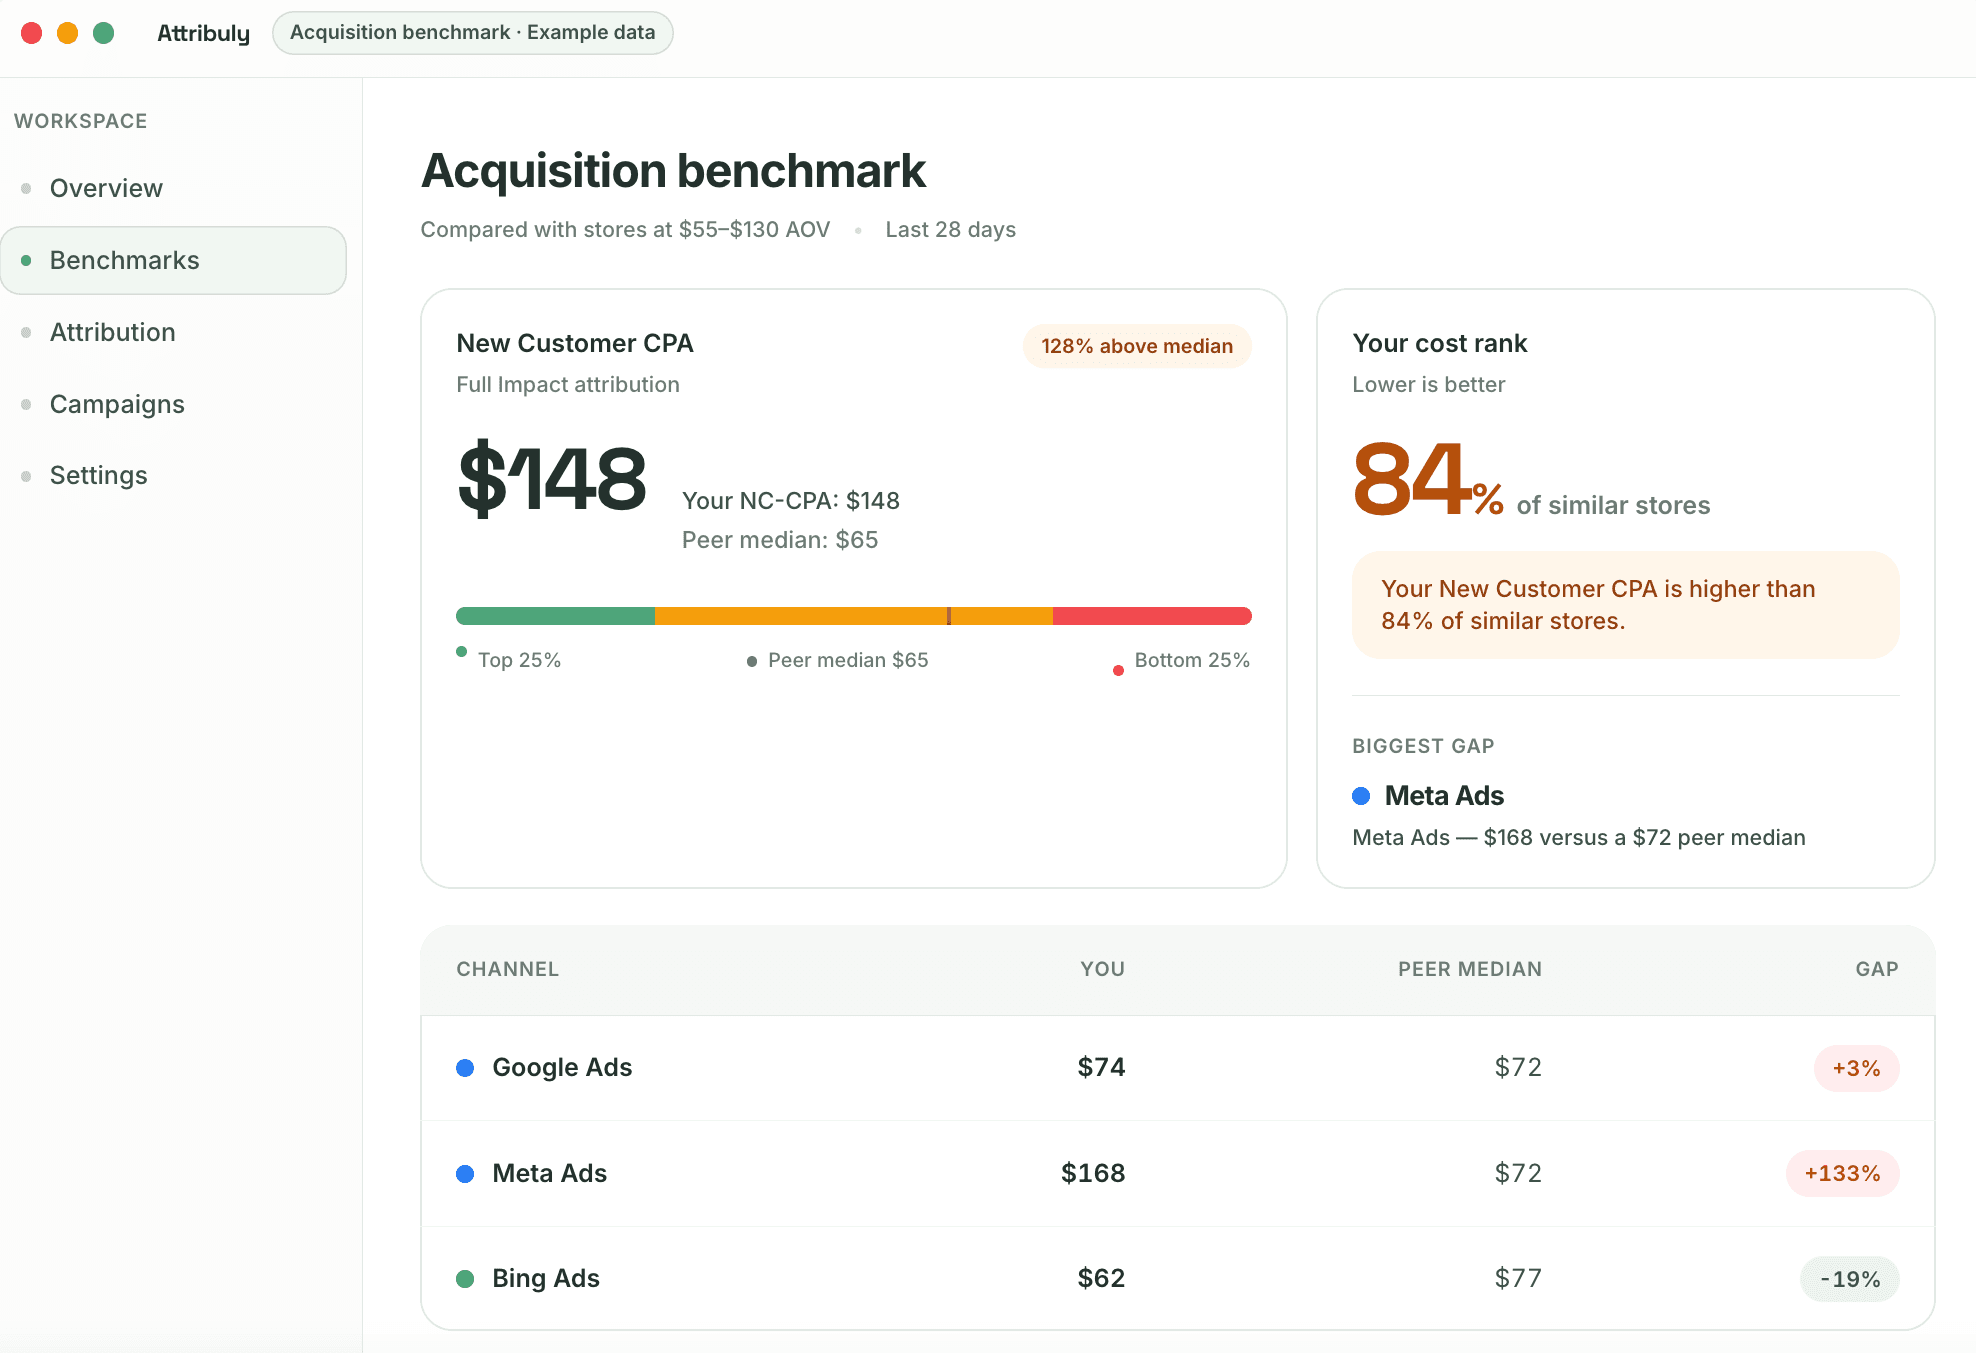
100% free. No paid plan required.
A Benchmark You Can Trust
To make every comparison meaningful, all stores follow the same NC-CPA calculation. We count first purchases only, include ad spend from connected channels such as Google, Meta, and TikTok, and use a rolling 28-day window. Cancelled and fully refunded orders are excluded, and attribution follows the Attribuly Full Impact model.
Your store-level data stays private. The benchmark is built from aggregated and anonymized data across 400+ brands, so you can compare your performance with the market without another merchant ever seeing your store's private NC-CPA, spend, revenue, or channel performance.
NC-CPA Is Just the Beginning
The same question applies to almost every marketing metric: Is this number actually good? A 2x ROAS may look reasonable, but what if comparable stores are usually achieving 4x? A 2% conversion rate may feel normal, but what if the median for similar stores is already 3%?
NC-CPA is the first in a broader benchmark series. Next, we're bringing the same comparison to CPC, CTR, CPM, CVR, and ROAS, so you'll have more context to understand your performance before deciding what to optimize.
Benchmark My Store →See what similar stores pay, understand where you stand, and find where the biggest gaps are. Tell us what metric you want next, and we'll bring it into our roadmap.
Need help? Our support team is always available at support@attribuly.com.
Cheers,
Alex Liju
Founder of Attribuly